Skip to content
This repository was archived by the owner on Jul 3, 2026. It is now read-only.

multiverseweb/Dataverse

Repository files navigation

Dataverse

Warning

[ARCHIVED] This project is no longer maintained and is read-only. It serves as a public archive.

Data Visualisation Software & Finance Tracker

Visitors License Languages GitHub Repo stars GitHub contributors GitHub issues GitHub closed issues GitHub forks GitHub pull requests GitHub closed pull requests GitHub last commit GitHub repo size GitHub total lines


Table of Contents

About Dataverse Application Preview Repository Structure Installation

What does this software do?

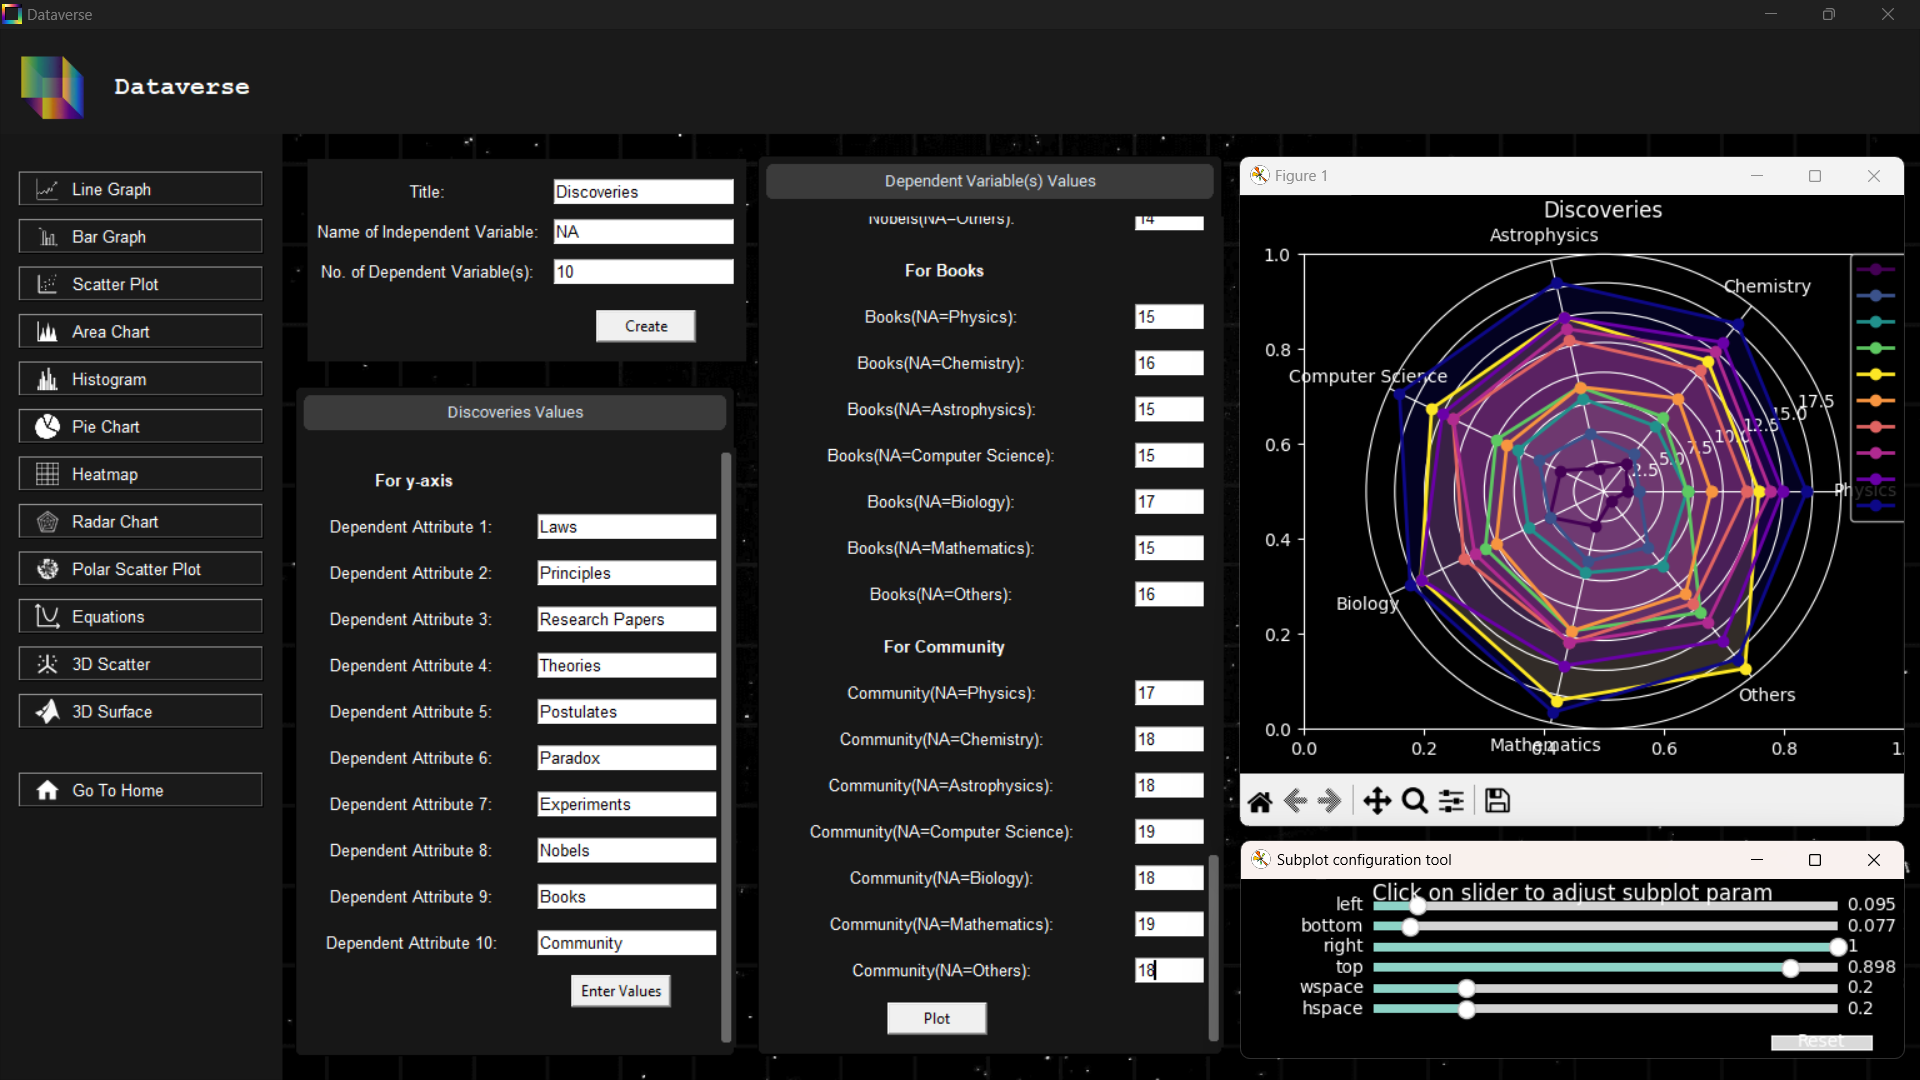
  • Provides a graphical interface for generating Matplotlib charts.
  • Supports visualizing datasets without writing Python code.
  • Generates interactive, customizable and exportable graphs.
  • Serves as a local tool for rapid data visualization.
Preview

Software GUI


View More


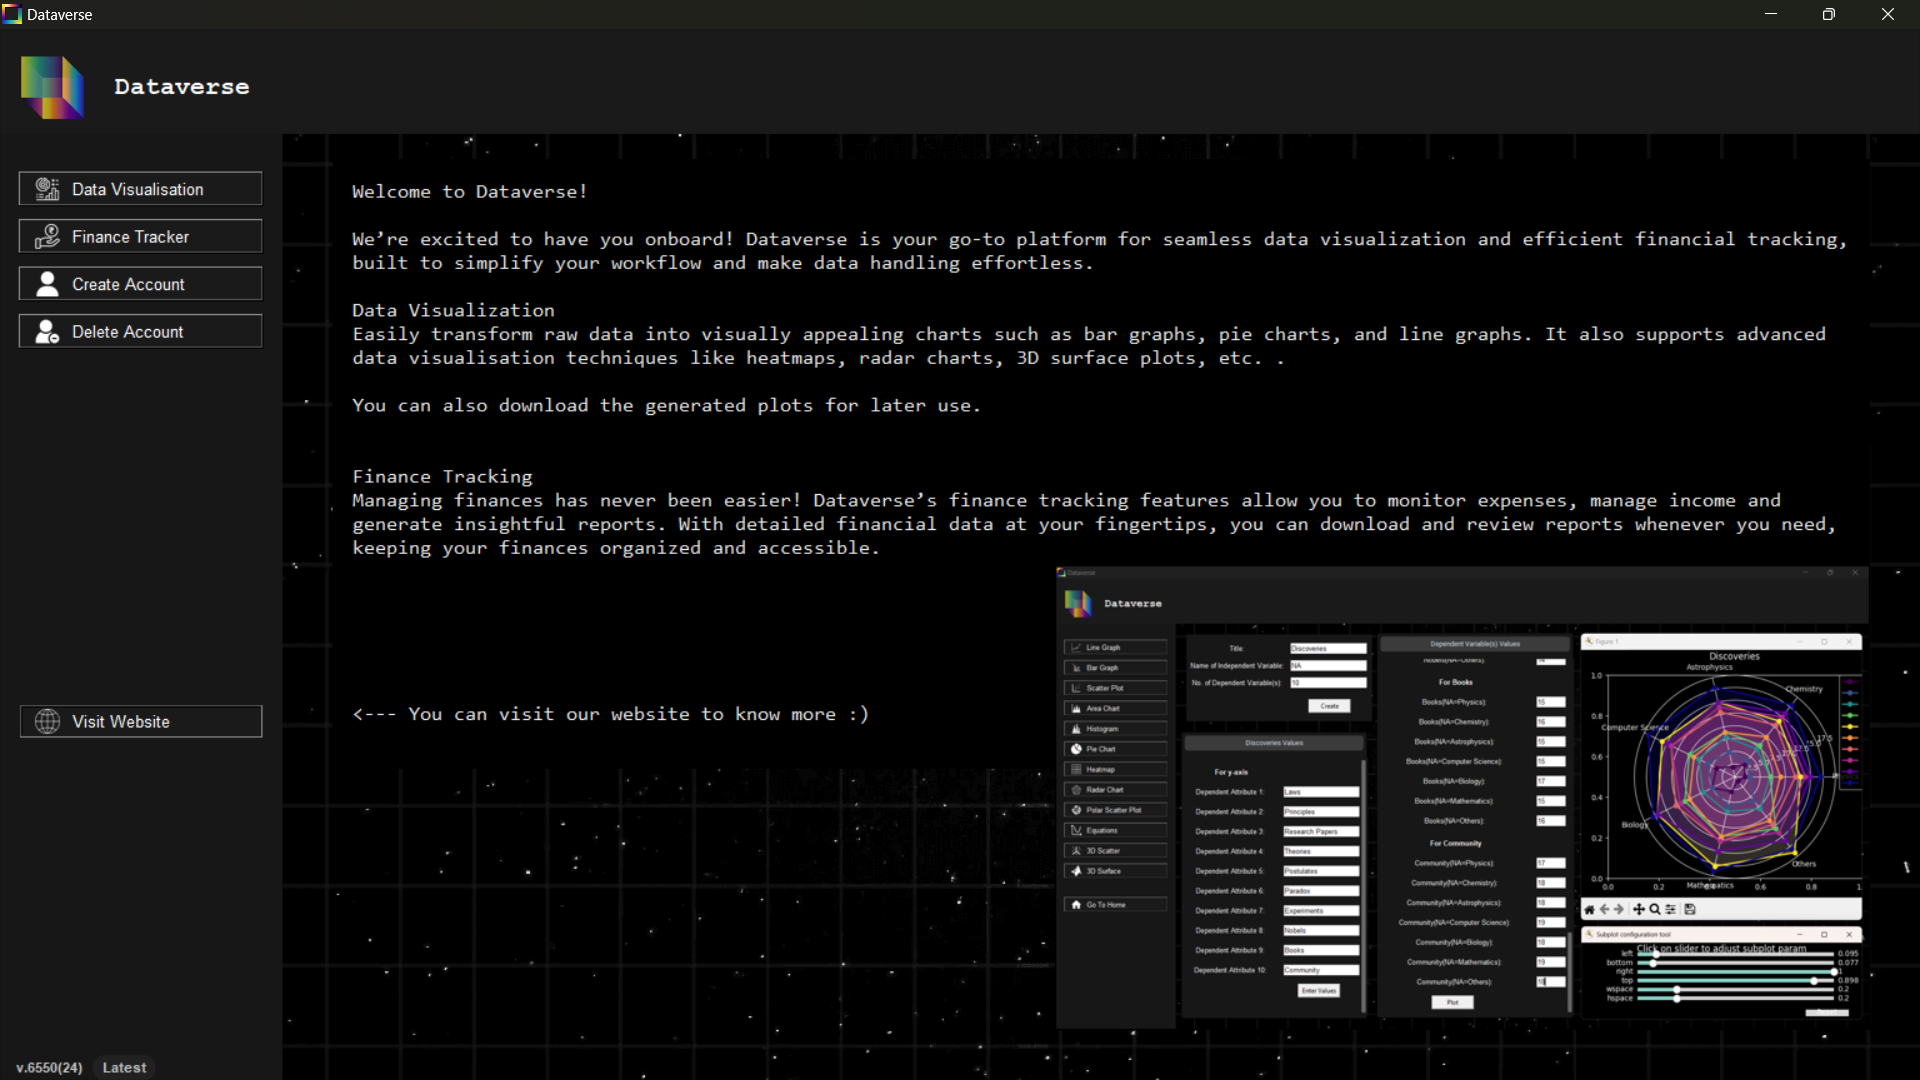
Software Home Page

Repository Structure

📂 View Repository Structure

Installation (Windows)

A pre-compiled executable is provided for Windows users, eliminating the need to install Python or any dependencies.

  1. Go to the GitHub Releases page.
  2. Download the latest Dataverse.exe.
  3. Double click the .exe file to run the application.

Note

If you prefer to run from source, you can clone the repository and run pip install -r requirements.txt followed by python software/main.py.

Now, the software should run smoothly with no errors. Enjoy visualizing your data!


Star History Chart

Back to top

About

A robust Data Visualisation and Finance Tracker application. It supports interactive graph generation, financial expense tracking, predictive analytics via machine learning, and secure data storage through a mobile-friendly interface.

Topics

Resources

License

Code of conduct

Security policy

Stars

66 stars

Watchers

2 watching

Forks

Packages


Contributors