Real-time Docker infrastructure visualizer. See your containers, networks, volumes, and their relationships as an interactive graph that updates live as your infrastructure changes.





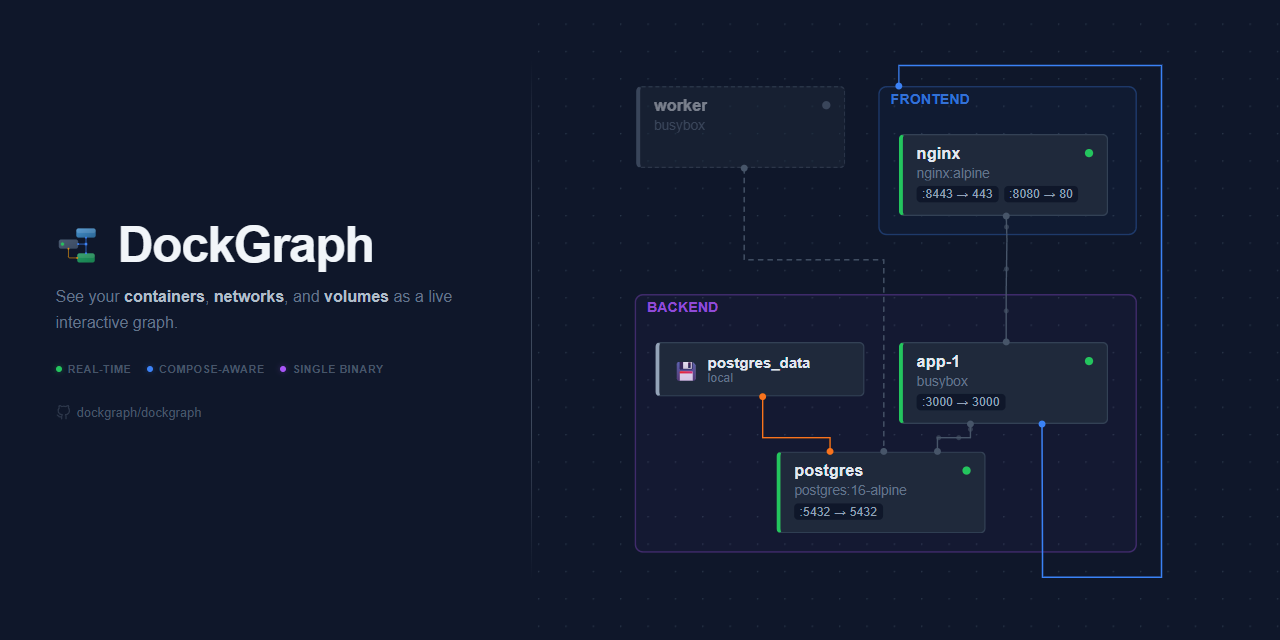
- Live topology graph — containers, networks, and volumes rendered as an interactive, zoomable graph
- Table view — alternative tabular view with sortable columns, grouping by compose project / network / status / driver, and collapsible groups
- Dashboard view — 13-card monitoring dashboard with resource charts, top consumers, event timeline, alerts, disk usage, images, and compose project overview
- Global logs — a unified, time-ordered log stream that aggregates every container into one view to trace an event across services; filter by text (literal or regex) or container, drill in with per-row filter actions, scroll back through merged history alongside the live tail, and find within (Ctrl+F)
- Pop-out log windows — open any container's logs in a floating, movable and resizable window; drag windows together into tabs, minimize them to a dock, and search within each
- Detail panels — click any resource to inspect stats, ports, mounts, environment, labels, logs, health checks, and network configuration; cross-references (dependencies, networks, mounted volumes) link straight to the related resource, and any value is click-to-copy
- Real-time updates — watches the Docker event stream; the graph reflects changes within seconds
- Compose-aware — parses compose files to show services that haven't started yet, with the same detail panel as running containers (process config, environment, labels, ports, dependencies, and volume mounts) and clickable cross-references into the resources they'll create
- Network grouping — containers are visually grouped by their primary network
- Dependency visualization —
depends_onedges with animated flow dots for running services - Volume relationships — named volume mounts shown as edges between volumes and containers
- Multi-network support — secondary network connections rendered as cross-group edges
- Search and filter — filter resources by name, type, or status with real-time results across both views
- Dark/light theme — toggle between themes, persisted in localStorage
- Click-to-highlight — click any node or edge to highlight its connections, fading unrelated elements
- Password protection — optional authentication with Argon2id hashing and JWT sessions
- Single binary — frontend is embedded into the Go binary; one container, no external dependencies
- Self-excluding — DockGraph hides its own container, networks, and volumes from the graph
docker run -d \
  -p 7800:7800 \
  -v /var/run/docker.sock:/var/run/docker.sock:ro \
  --label dockgraph.self=true \
  dockgraph/dockgraph
Open http://localhost:7800.
Add DockGraph as a service in your existing compose.yml:
services:
  dockgraph:
    image: dockgraph/dockgraph:latest
    ports:
      - "7800:7800" # Web UI
    volumes:
      - /var/run/docker.sock:/var/run/docker.sock:ro # Docker API access
      - ./compose.yml:/compose/compose.yml:ro # Optional: show services before they start
    labels:
      dockgraph.self: "true" # Hide DockGraph from its own graph
Compose file mounts are optional — they let DockGraph show services defined in your compose files even when they aren't running yet. Just mount a file or directory and DockGraph picks it up automatically.
Three demo stacks of increasing complexity are included for showcasing DockGraph at different scales — from a 5-service web app to a ~46-service SaaS platform. See demo/README.md for setup and architecture.
DockGraph auto-detects compose files from mounted volumes — no extra configuration needed. Any bind-mounted file or directory (except the Docker socket) is scanned recursively for .yml/.yaml files.
# Single file
volumes:
  - /var/run/docker.sock:/var/run/docker.sock:ro
  - ./compose.yml:/compose/compose.yml:ro           # auto-detected

# Entire directory (all .yml/.yaml files picked up recursively)
volumes:
  - /var/run/docker.sock:/var/run/docker.sock:ro
  - ./stacks:/compose/stacks:ro                     # auto-detected

# Multiple mounts
volumes:
  - /var/run/docker.sock:/var/run/docker.sock:ro
  - ./frontend.yml:/compose/frontend.yml:ro          # auto-detected
  - ./infra:/compose/infra:ro                        # auto-detected

# Override auto-detection with DG_COMPOSE_PATH
volumes:
  - /var/run/docker.sock:/var/run/docker.sock:ro
  - ./stacks:/compose/stacks:ro
environment:
DG_COMPOSE_PATH: "/compose/stacks/production.yml" # scan only this file| Variable | Default | Description |
|---|---|---|
DG_BIND_ADDR |
0.0.0.0 |
Listen address (127.0.0.1 to restrict to localhost) |
DG_PORT |
7800 |
HTTP listen port |
DG_POLL_INTERVAL |
30s |
Docker API polling interval |
DG_COMPOSE_PATH |
(auto-detect) | Override: comma-separated list of compose files or directories to scan |
DG_PASSWORD |
(disabled) | Password for UI and WebSocket access; when set, requires login to view the dashboard |
DG_STATS_INTERVAL |
3s |
Container stats poll interval (Go duration) |
DG_STATS_WORKERS |
50 |
Max concurrent stats API calls |
DockGraph requires access to the Docker daemon socket to read container, network, and volume state. Be aware of the following:
- Password protection. Set
DG_PASSWORDto require authentication for the web UI and WebSocket connections. When set, all access goes through a login page — the dashboard and its data are not served until the correct password is provided. Sessions last 7 days and are invalidated on server restart.Whenenvironment: DG_PASSWORD: "your-secure-password"
DG_PASSWORDis not set, DockGraph runs without authentication (suitable for localhost or trusted networks). - Bind to localhost when running on a shared network or production host:
environment:
  DG_BIND_ADDR: "127.0.0.1"
- Use a reverse proxy (nginx, Caddy, Traefik) for TLS termination if exposing DockGraph beyond your local network. DockGraph serves plain HTTP — the reverse proxy handles HTTPS.
- Docker socket access is read-only (
:ro), but any process that can read the socket can inspect all Docker resources on the host. Run DockGraph in a network-isolated environment or behind a firewall. - Read-only API. DockGraph cannot start, stop, or modify containers. It only observes topology.
- Secret masking. Environment values whose keys look like credentials (
PASSWORD,SECRET,KEY,TOKEN,AUTH, …) are masked before leaving the server — for both running containers and parsed compose services — so they're never sent to the browser.
DockGraph runs two collectors concurrently:
- Docker collector — polls the Docker API and watches the event stream for container, network, and volume changes
- Compose collector — auto-detects compose files from mounted volumes, parses them, and watches for filesystem changes
Both feed into a state manager that merges their outputs (Docker runtime data takes precedence) and broadcasts the unified graph over WebSocket. The React frontend receives these updates and renders the topology using the ELK layout algorithm.
For implementation details, see the backend and frontend READMEs.
- Go 1.26+
- Node.js 24+
- Docker daemon
make build          # Build frontend + backend
make test           # Run all tests (backend + frontend)
make test-coverage  # Run tests with coverage reports (enforces thresholds)
make lint           # Run all linters (golangci-lint + eslint)
make docker         # Build Docker image locally
make docker-up      # Start with Docker Compose
make help # Show all available targets# Backend
cd backend
go build -o dockgraph .
./dockgraph
# Frontend
cd frontend
npm install
npm run devThe Vite dev server proxies /ws and /healthz to the backend at localhost:7800.
make test              # Run all tests
make test-coverage # Run with coverage (backend profile + frontend thresholds)| Component | Technology |
|---|---|
| Backend | Go, Docker Engine API, gorilla/websocket |
| Frontend | React 19, TypeScript, React Flow, ELK.js |
| Build | Vite, multi-stage Dockerfile |
| Runtime | distroless/static (production image) |
Existing Docker UIs focus on container management, not on understanding how your infrastructure fits together. DockGraph was born out of the need to see the full picture — containers, networks, volumes, and their relationships — at a glance, updating in real time as things change.
If you find this project useful, please consider giving it a ⭐ — it helps others discover it.
Contributions are welcome. Please read the contributing guide before submitting a pull request.
This project follows the Contributor Covenant code of conduct.
This project is licensed under the Business Source License 1.1. You are free to use, modify, and redistribute the software, including in production. The only restriction is offering it as a hosted service or embedding it as a feature in a commercial product. Each version converts to Apache License 2.0 four years after its release.