Student Project from the Course COM-480 Data Visualization Course at EPFL
The goal of our project is to give a better understanding of Co2 emissions and how it impacts the climate. Tackling this problem has become a priority, and the young generation is taking actions through activism, entrepreneurship or in politics. However, some facts about global Co2 emissions are still not known, and might sometimes be unclear. Experts often use different metrics, and their reports can be hard to follow.
As as result, we give an easily understandable overview of the various emissions, and hope to educate the users of our website with different interactions.
First, we show the global situations of Co2 emissions and then we dive into each contributing sector individually (Energy, Industry, Agriculture, and finally Transportation).
Our project is structured as follows:
├───JS               (Our javascript files)
├───imgs             (Images used in the website)
├───milestones       (Milestones)
├───data             (Data used in visualizations)
├───lib              (Libraries)
├───index.html       (Webpage)
├───style.css        (Styling)
For each visualization on our website we have a different data source.
Global Overview: Greenhouse Gas Emissions by Country
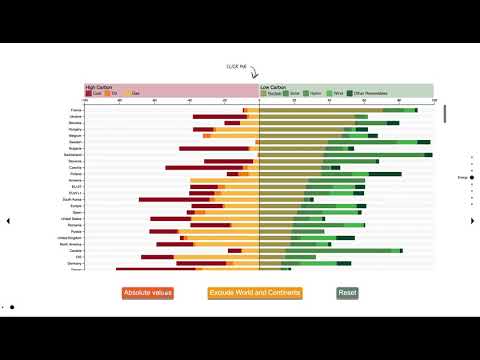
Energy: Electricity source by country
Industry: Industry emissions by material
Agriculture: Food Emissions
Transport: Transporation emissions
Milestone 1: Initial idea
Milestone 2: Idea refined - First prototype
Milestone 3: Final Website - Process Book
| Student's name | SCIPER |
|---|---|
| Guerraoui Nada | 263850 |
| Jouve Maxence | 269716 |
| Jonsson Adalsteinn | 336263 |