ParparVM performance: parity with warmed Java 25 (geomean 1.00x)#5327
ParparVM performance: parity with warmed Java 25 (geomean 1.00x)#5327shai-almog wants to merge 68 commits into
Conversation
…ry GC, tagged Integer

A body of AOT performance work, all gated/validated against bit-identical
checksums vs Java SE and the clean-C test path. Off by default where flagged.

- Small-value box caches for Integer/Long/Short/Character (valueOf -128..127),
  eliminating autoboxing allocation in tight loops.
- Bounds-check elimination: prove-safe pass for the canonical induction loop
  (ArrayLoadExpression/ArrayLengthExpression/Instruction), unlocking SIMD.
- Inlining of trivial monomorphic accessors (Invoke).
- Conditional-volatile locals (BytecodeMethod): emit `volatile` only when a
  method has try/catch/synchronized/calls, letting clang register-allocate and
  vectorize call-free compute loops (3.6x on array reduce, no regressions).
- Thread-local non-moving nursery GC behind -DCN1_NURSERY (cn1_globals.*,
  nativeMethods.m): in-place promotion, write barrier, adaptive survival-based
  bypass, block-lifecycle free-stack fix; main thread made lightweight so the
  concurrent GC pauses it. 2x on objectAllocation, off by default.
- Tagged small-Integer "poor man's Valhalla" behind -DCN1_TAGGED_INT, 64-bit
  pointers only (auto-off on armv7/armv7k/arm64_32): Integer.valueOf returns an
  immediate tagged pointer, GC ignores it, CN1_CLASS_OF substitutes Integer's
  class in dispatch/instanceof, value reads route through a tag-aware native,
  monitor ops NOP. Plus an inline tagged hashCode/equals dispatch fast path for
  collections. 2x on hashMapChurn (GC eliminated), bit-identical to HotSpot.
- Opt-in LTO flag (ByteCodeTranslator) for release/perf builds.

Co-Authored-By: Claude Opus 4.8 (1M context) <noreply@anthropic.com>
…owering

makeConcatWithConstants/makeConcat are desugared to a synthetic StringBuilder
helper. Pre-size that StringBuilder from the recipe literals + per-argument
length estimates so the common-case concat never grows its char[] (each growth
is a fresh array + arraycopy). Over-estimates are harmless; under-estimates
still grow correctly. Verified bit-identical to HotSpot on a concat microbench.

Co-Authored-By: Claude Opus 4.8 (1M context) <noreply@anthropic.com>
…d-teaming

A comprehensive edge-case test (getClass, isInstance, instanceof, equals across
tagged/heap/null/non-Integer, compareTo via TreeMap, all Number methods,
HashMap/HashSet/TreeMap/ArrayList, Arrays.sort, switch, concat, synchronized,
MIN/MAX_VALUE) crashed the -DCN1_TAGGED_INT build in four places the original
benchmark never exercised. All were native/codegen paths dereferencing a tagged
pointer's (nonexistent) object header:

- Object.getClassImpl: read this->header -> tag-aware (returns Integer.class).
- Class.isInstance(obj): read obj->header -> CN1_CLASS_OF + null guard.
- String equals-family: read arg->header->classId -> CN1_CLASS_OF(arg).
- Interface dispatch (e.g. Comparable.compareTo via TreeMap): the classId index
  read this->header->classId -> CN1_CLASS_OF (ByteCodeClass interface vtable gen).
- CN1_CLASS_OF itself: a plain ternary let clang if-convert and SPECULATIVELY load
  the faulting tagged header before the tag test (crash with no inline fast-path
  guard, e.g. interface compareTo). Reworked to select a valid object pointer
  first (a static JavaObjectPrototype proxy whose header is Integer's class), so
  the single header load is always on a dereferenceable address.

Result: full edge-case test bit-identical across default / tagged / tagged+nursery,
and the Bench suite still matches HotSpot with no regression.

Co-Authored-By: Claude Opus 4.8 (1M context) <noreply@anthropic.com>
The inner chain walk (findNonNullKeyEntry) and key equality (areEqualKeys, with a
pointer-== fast path that already short-circuits tagged-int keys) were already
native. But get still went through translated-Java wrappers: get -> getEntry ->
computeHashCode(key.hashCode()) -> findNonNullKeyEntry. Collapse those into one C
function; for a tagged Integer key the hashCode is an inline untag via the
dispatch fast path. Bit-identical to the Java getEntry path (EdgeTest
default==tagged, full edge matrix). ~1.25x on hashMapChurn (6858 -> 5471ms, 20
reps), general (helps the default build too, not gated). First step of the
native-collection-fast-path work: the algorithm in C beats HotSpot 3.5x at the
ceiling, so collapsing the remaining wrappers (put) and ultimately open-addressing
storage is the path to parity/better.

Co-Authored-By: Claude Opus 4.8 (1M context) <noreply@anthropic.com>
Same pattern as native get: collapse put/putImpl/computeHashCode into one C call,
reusing the native chain walk and the Java createHashedEntry/rehash slow path. The
only store this owns is entry.value = value, which carries an explicit
CN1_WRITE_BARRIER (the Java version emitted one). Bit-identical (EdgeTest
default==tagged unchanged, 8424060826785033831).

hashMapChurn (20 reps, tagged): 5471 (get-only) -> 3952ms with put too; 6858 ->
3952 = 1.74x from native get+put. Now ~6.6x behind HotSpot (598ms), down from
~26x at session start. Remaining gap is the per-key Entry allocation (chaining) +
createHashedEntry/rehash; open-addressing storage is the next lever (the C ceiling
with no Entry objects beats HotSpot 3.5x).

Co-Authored-By: Claude Opus 4.8 (1M context) <noreply@anthropic.com>
append(int)/append(long) were `append(Integer.toString(i))` -- a temporary String
(plus its char[]) allocated on every call. Replace with native methods that write
the decimal digits straight into the builder's char[] (digits generated in
negative space so INT/LONG_MIN don't overflow). No per-append allocation. General
(not gated). Validated bit-identical to HotSpot on a string-building microbench
(append String/int/char/long chains + toString), which is now ~7.2x behind HotSpot
(the ~13x tier). The char append/String append/charAt/getChars were already native.

Co-Authored-By: Claude Opus 4.8 (1M context) <noreply@anthropic.com>
clear()/removeEntry() now recycle entries onto a free list (cn1FreeList, a
GC-marked field; key/value nulled to release refs) instead of dropping them to
GC, and createHashedEntry pops from the pool before allocating. After the first
fill, churn patterns (fill/clear loops, add/remove steady state) allocate nothing
-- the case a generational nursery can't help because the entries escape into the
map. origKeyHash made non-final so pooled entries can be re-keyed.

hashMapChurn (20 reps, tagged): 3952 -> 1782ms (2.2x). Now ~2.9x behind HotSpot
(620ms), down from ~26x at session start (tagged ints -> native get -> native put
-> entry pool). Validated: EdgeTest default==tagged unchanged, 8/8 GC stress,
checksum bit-identical to HotSpot.

Co-Authored-By: Claude Opus 4.8 (1M context) <noreply@anthropic.com>
toString() previously always allocated a fresh String + copied the char[]. Now it
SHARES the buffer with the returned String (via the offset/count String ctor) and
sets `shared`. append() stays untouched -- it only writes beyond the String's view
or reallocates via enlargeBuffer (which clears `shared`), so it's safe to share.
Only the editing mutators (setCharAt/insert/delete/deleteCharAt/reverse/setLength)
copy-on-write via cn1Unshare(). The copy-on-write scaffolding was already designed
(commented out); this wires it through cn1Unshare().

Validated: a toString-then-mutate test (setCharAt/insert/delete/reverse/setLength,
re-checking earlier Strings) is bit-identical to HotSpot; string-building bench
bit-identical and 2191 -> 1541ms (~7.2x -> ~4.4x behind HotSpot); EdgeTest AOT
unchanged. General (not gated) -- every toString in the system avoids a copy.

Co-Authored-By: Claude Opus 4.8 (1M context) <noreply@anthropic.com>
Methods that make calls couldn't use the fast leaf frame (the stack trace must
keep their frame), so they paid a NON-INLINE initMethodStack() on entry and
releaseForReturn() on exit -- two function calls per invocation, brutal for hot
recursive/call-dense code. initMethodStack's only extra work vs the fast path is
recording the class/method id (two array writes for the trace). Move both to
static-inline (cn1InitMethodStackInline keeps the name recording; releaseForReturn
inlined) so the C compiler folds the offset arithmetic and the call overhead is
gone. Also adds the threadObjectStack-overflow guard the fast path already had.

recursion 6.66x -> 4.89x, hashMapChurn 4.6x -> 3.95x, quicksort/objectAllocation
slightly better; compute unchanged (already inline via the fast frame). Bit-
identical to HotSpot, EdgeTest unchanged. Broad: helps every call-dense method.

Co-Authored-By: Claude Opus 4.8 (1M context) <noreply@anthropic.com>
POP_INT/POP_LONG/POP_OBJ used a non-inline pop(&SP) -- a function call for a
pointer decrement, hit on every pop including hot return paths (return
POP_LONG()). Make it static inline. Broad, helps all stack-popping code.
Bit-identical (EdgeTest unchanged, fib result matches HotSpot).

Co-Authored-By: Claude Opus 4.8 (1M context) <noreply@anthropic.com>
…jects

Annotation-driven escape elimination (the AOT-correct replacement for the
nursery, which was a synthetic win + ~10% universal write-barrier tax). A class
marked @com.codename1.annotations.StackAllocate has each `new` lowered to a
method-scoped C struct instead of codenameOneGcMalloc: no malloc, no heap
registration, no GC mark/sweep -- the object dies with the frame. Intended for
internal short-lived value/temporary types where non-escape is known by
construction (the developer asserts it; violating it dangles).

Mechanics:
- StackAllocate: TYPE-target, CLASS-retention marker annotation.
- Parser detects it at class level -> ByteCodeClass.stackAllocatable.
- BytecodeMethod pre-scans each method and declares one frame-scoped
  `struct obj__T __cn1stk_<site>;` per @StackAllocate NEW site (reused across
  loop iterations -- only one instance per site is live at a time).
- TypeInstruction NEW replicates exactly what __NEW_T does (run the static
  initializer, set the same header fields codenameOneGcMalloc sets) but SKIPS
  heap registration, so the sweep never visits it. Its pointer rides the operand
  stack, so the GC still reaches it as a root and scans its fields -- any heap
  objects it references stay live.

Tax-free and opt-in: codegen only diverges when stackAllocId>=0, so non-annotated
code is byte-for-byte unchanged.

Validated:
- 60M-iteration non-escaping temporary (Vec2): 4.51x faster than the heap path
  (45x -> 10x behind HotSpot), bit-identical checksum vs heap build and HotSpot.
- GC red-team: a @StackAllocate Holder owning a heap Payload with System.gc()
  forced mid-loop -> bit-identical to HotSpot, no premature collection, no crash
  (proves the GC marks through the stack object).
- Full parparvm-bench suite (zero annotations) still bit-identical to HotSpot.

Residual 10x vs HotSpot is the per-iteration memset + header init + operand-stack
traffic that full scalar replacement (object -> field locals) would remove next.

Co-Authored-By: Claude Opus 4.8 (1M context) <noreply@anthropic.com>
…registers

Builds on the @StackAllocate stack-alloc foundation (d4185da). A primitive-only
@StackAllocate object used as a simple local temporary is now turned into a pure C
local struct whose address is NEVER taken, so clang's SROA promotes its fields to
registers and the object vanishes -- matching what HotSpot's escape analysis does,
which the prior stack-alloc path could not because the struct's address escaped to
the GC-scanned operand stack (measured: that escape alone cost 2.4x).

Transform (a conservative, bail-on-doubt pass in BytecodeMethod.optimize()):
recognize NEW X; DUP; <args>; INVOKESPECIAL X.<init>; ASTORE n where
 - X is @StackAllocate, a DIRECT Object subclass, primitive-only instance fields,
   no <clinit> (so dropping super.<init>/static-init is sound, and there are no
   heap refs the GC must scan -> the object need never be a GC root);
 - X.<init> is exactly Object.<init> + a param->field bijection (every field
   assigned exactly once from a distinct ctor param of matching type) -- analyzed
   by srAnalyzeCtor, else bail;
 - local n is used ONLY as ALOAD n; GETFIELD X.f (srValidateLocalUses: any other
   use -- pass/return/PUTFIELD/second store/type-confusion -- bails);
 - the arg region has no nested NEW/<init>/stack-shuffle/branch, else bail.
Then: NEW emits nothing (no header/memset/PUSH); DUP and ASTORE are dropped;
INVOKESPECIAL <init> becomes ScalarAllocInit, which folds the (already reduced)
arg expressions straight into __cn1sr_<id>.field = <expr> (or, if an arg isn't a
pure expression, falls back to popping the operand stack in order -- both are
stack-balanced); GETFIELD on local n becomes direct __cn1sr_<id>.field. Anything
not matching keeps today's GC-safe stack-alloc codegen. Off-by-default escape
hatch: DISABLE_SCALAR_REPLACE.

Validated (independently rebuilt + re-run, not just the implementing agent):
- SA (60M non-escaping Vec2 long-field temporaries): generated work() has 0
  get_field/PUSH_POINTER/__NEW/Vec2___INIT (struct register-promoted), checksum
  bit-identical to HotSpot, 528ms -> 120ms (4.40x faster than stack-alloc).
- SA2 (Holder with a HEAP Payload field, System.gc() forced mid-loop): primitive-
  only gate BAILS (0 __cn1sr_), keeps stack-alloc, bit-identical, no crash. The
  critical GC-safety gate.
- Full parparvm-bench suite (51 checksums, zero annotations): all bit-identical to
  HotSpot. Scalar replacement is a clean no-op on un-annotated code.

Residual vs HotSpot (2.35x) is ambient ParparVM frame/line scaffolding
(__CN1_DEBUG_INFO per-source-line stores), orthogonal to object handling -- the
object-elimination win is fully realized (the hand-C floor for this loop is 36ms,
below HotSpot's 51ms).

Co-Authored-By: Claude Opus 4.8 (1M context) <noreply@anthropic.com>
…torize it)

A Java long comparison `a < b` compiles to LCMP (three-way -1/0/1) + IFxx, which
the translator emitted as `CN1_CMP_EXPR(a,b) <op> 0` -- a `(a==b)?0:(a>b)?1:-1`
chain compared to zero. clang cannot recover the loop trip count through that, so
long-counted loops were neither analyzed nor vectorized. Measured: it was THE
residual on the scalar-replaced @StackAllocate benchmark -- replacing it with a
direct comparison was 2.07x and took that loop from 2.35x HotSpot to parity.

Fix: when an LCMP ArithmeticExpression feeds an IFxx branch-on-zero, emit the
direct `(a <op> b)` instead (ArithmeticExpression.getLongCompareDirect, used in
the IFxx branch-fusion in BytecodeMethod). Long only -- float/double (FCMPx/DCMPx)
keep CN1_CMP_EXPR because their NaN ordering differs from a direct C comparison.
Safe and bit-identical: the folded operands are pure (the reducer only folds
loads/constants/pure expressions), so `(a<op>b)` evaluated once equals
`CN1_CMP_EXPR(a,b)<op>0` for every long value -- and avoids the macro's
double-evaluation of each operand. General: helps every long-counted loop, not
just @StackAllocate.

Validated (bit-identical to HotSpot):
- Long-edge test: all 6 operators (< <= > >= == !=) over {Long.MIN, MAX, -1, 0,
  1, MIN+1, MAX-1} (81 pairs) -- checksum identical, fusion fired (0 CN1_CMP_EXPR).
- Full parparvm-bench suite (51 checksums) -- all identical.
- SA (scalar-replaced Vec2 loop) -- identical, 120ms -> 56ms = 1.08x HotSpot
  (was 2.35x); SA2 unaffected, identical.

Co-Authored-By: Claude Opus 4.8 (1M context) <noreply@anthropic.com>
The per-source-line __CN1_DEBUG_INFO store (callStackLine[frame] = line) was the
last hot-path cost keeping tight loops out of registers -- it was the entire
residual on the scalar-replaced @StackAllocate benchmark (56ms -> 40ms once gone).

A frame's reported trace line is only ever read at a capture/throw/call site, and
every such site lives on a line that calls, allocates, or does a throwing op
(field/array/div/new/athrow). A line whose every instruction is non-throwing and
non-calling (primitive arithmetic, local load/store, constants, compares,
branches, conversions) can therefore NEVER be the line a trace reports -- so
eliding its store is trace-IDENTICAL, not a line-number regression.

Implementation:
- BytecodeMethod.analyzeElidableLineInfo() marks each LineNumber whose source line
  has no throwing/calling instruction (canThrowOrCall(): conservative -- default
  keep; only an explicit non-throwing whitelist is elidable; numeric/String LDC
  and a scalar-replaced NEW are non-throwing; integer div/rem, array/field/static
  access, invoke, new*, athrow, checkcast, monitor are kept). Runs AFTER scalar
  replacement so a scalar-replaced object's now-pure NEW/<init>/field access is
  seen as non-throwing.
- LineNumber emits the elidable store as __CN1_DEBUG_INFO_NT, which is the full
  store under the on-device debugger (which steps line-by-line and needs every
  line) and a no-op in release/device builds -- where it removes the only per-line
  cost. Throwing/calling lines keep __CN1_DEBUG_INFO, so the reported line is
  always live and exact.

Validated:
- Full parparvm-bench suite (51 checksums) bit-identical to HotSpot -- execution
  unchanged; the elision applies to every method with no regression.
- SA (scalar-replaced Vec2 loop): all hot lines elide, checksum bit-identical,
  release 56ms -> 40ms = 0.62x HotSpot (BELOW the JIT, at the hand-C floor).
  SA2 (object field, gc() forced) bit-identical.
Note: empirical printStackTrace trace validation is blocked in the standalone
`clean` target by a PRE-EXISTING trace-builder crash on null constant-pool strings
(both elision-on and elision-off segfault identically -- unrelated to this change);
trace-identity rests on the construction argument above + bit-identical execution.

Co-Authored-By: Claude Opus 4.8 (1M context) <noreply@anthropic.com>
Parallelizes the transitive mark DRAIN across a persistent worker pool while
leaving codenameOneGCMark's per-thread park / root-snapshot logic unchanged, so
snapshot-at-the-beginning (mark all of a thread's reachable set before releasing
it) is preserved. Marking was already type-specialized (per-class markFunction,
leaf types skipped); this adds the parallelism.

- gcMarkObject parallel path claims unmarked->marked with an atomic CAS
  (__sync_bool_compare_and_swap); only the winner pushes. force/recursionKey
  re-scan stays entirely on the serial path (force is never set in parallel).
- Worklist: shared array under a mutex; each worker pops a 64-entry batch and
  buffers produced children in a __thread-local buffer, flushing in batches
  (broadcast wakes idle workers). Termination: a worker idles only when the
  shared worklist is empty AND its local buffer is flushed; the last worker to
  idle sets gcMarkDone. Overflow still falls back to the serial heap-rescan
  fixed point; the nursery promote path and force re-scan stay serial.
- The __thread worklist-buffer pointer doubles as the "am I a parallel worker?"
  discriminator: when NULL (the GC thread between drains, N=1, overflow rescan)
  gcMarkObject/push take the ORIGINAL serial code verbatim -- no atomics, no lock.
- CN1_GC_MARK_THREADS overrides the marker count; default min(4, ncpus-1) at
  runtime; N=1 is byte-for-byte the previous behavior (no pool, no atomics).

Validated: full parparvm-bench suite bit-identical to HotSpot at N=1 AND N=4;
serial==parallel checksums identical; ThreadSanitizer clean on all introduced
mark-state synchronization (the remaining TSan reports are the collector's
pre-existing, inherent non-STW collector-vs-mutator reads -- unmodified HEAD
shows the same class of reports); GC stress (millions of objects, ~120 GCs/run)
stable and identical across 5 runs.

Measured-as-a-whole impact (vs serial mark, min-of-reps): objectAllocation
306->280ms (1.09x), everything else within noise. Marking is ~19.5% of the
GC-bound time and the bench's live-set-per-GC is small, so the whole-suite gain
is modest; the bulk of the GC gap (allocation fast path + concurrent-collector
throttle) is the next, larger target.

Co-Authored-By: Claude Opus 4.8 (1M context) <noreply@anthropic.com>
…ects

Replaces per-object calloc + allObjectsInHeap registration + per-object free()
with a non-moving segregated-fits (BiBOP) page heap for small non-array objects.
Arrays and objects > MAX size class keep the verbatim legacy aligned calloc +
allObjectsInHeap path -- so real array offsets, stable addresses, and SIMD/GPU
alignment are untouched. NON-MOVING (objects never move -> no write barrier, no
pointer fix-ups / shadowing -- the reasons generational was rejected do not apply)
and NON-GENERATIONAL (whole-heap collect).

Design:
- 64KB posix_memalign'd pages, one size class each (15 classes 32..512B; >512 or
  arrays -> legacy path). Every slot >=16-byte aligned.
- Allocation: per-thread (__thread) current page per class; pop the page free-list
  else bump the cursor (lock-free, thread-local). Page full -> retired to a global
  SWEEP stack (atomic CAS push); grab a fresh/partial page from the pool (one
  bibopMutex acquisition per page, not per object). Slot re-zeroed + header set
  exactly as codenameOneGcMalloc. Small objects are NOT registered in
  allObjectsInHeap -- the pages track them.
- Liveness: the existing per-object epoch mark (__codenameOneGcMark) stays the
  single source of truth, so gcMarkObject + the parallel mark pool + the proven
  grace semantics (mark==-1 grace, mark<cur-1 dead) are UNCHANGED and work
  uniformly on page slots and legacy table objects. No per-page bitmap, no
  address->page table.
- Sweep: rebuild each retired page's free-list from its slot headers (finalizers
  still run); an all-dead page returns to the pool. Then the existing
  allObjectsInHeap sweep handles large/array objects.

The three correctness hinges:
1. Allocate-during-GC: a fresh slot is mark==-1 (one-cycle grace) AND lives on the
   thread's OWNED current page, which the concurrent sweep never touches (only
   retired pages, owner==0, are swept).
2. Sweep vs alloc: a page has exactly one role at a time -- OWNED (one thread
   allocates, never swept) -> retired to the SWEEP stack -> swept (owner==0) ->
   FREE/PARTIAL pool. The sweep snapshots the stack via atomic_exchange. No page
   is ever allocated-into and swept simultaneously.
3. No page-table race: dissolved -- header marking needs no address->page lookup;
   the append-only all-pages registry (release/acquire) is read only by the
   overflow rescan, and only at a slot whose atomically-read mark == current cycle.

Escape hatch: #ifndef CN1_DISABLE_BIBOP (default ON); -DCN1_DISABLE_BIBOP reverts
to the verbatim legacy collector. Independent of CN1_NURSERY (kept off).

Validated (macOS arm64): full parparvm-bench suite bit-identical to HotSpot with
BiBOP ON, -DCN1_DISABLE_BIBOP, and across 1/4/8 mark workers and forced worklist
overflow (-DCN1_GC_MARK_WORKLIST_SIZE=256, exercising the page rescan). TSan: zero
races on any BiBOP state (pages/pools/free-lists/registry/cursor) -- 111 reports
vs the legacy baseline's 119, all the pre-existing collector-vs-mutator object-
header family. GC-stress + 4-thread allocate-during-GC stress: checksums identical
across runs and to legacy/HotSpot (a single lost live object would diverge). RSS
24-26% LOWER than legacy and bounded over 2000 rounds (pages recycled, no drift).

Measured as a whole vs warmed Java 25 (+AOT cache), min-of-reps:
objectAllocation 278->144ms (1.93x; 15.1x->7.8x vs Java25), stringBuilding 1.14x,
hashMapChurn 1.05x, compute/arrays unchanged. Whole-suite geomean vs Java25
2.26x -> 2.08x, zero regression.

Co-Authored-By: Claude Opus 4.8 (1M context) <noreply@anthropic.com>
…x->1.6x HotSpot)

The per-call frame bookkeeping -- DEFINE_METHOD_STACK's per-call memset of the
locals+operand-stack elementStruct region, the callStackOffset bump/check, the
releaseForReturn offset restore, and the per-line __CN1_DEBUG_INFO stores -- is
pure overhead. A method that holds ZERO object references in its frame contributes
no GC roots, so the precise collector has nothing to scan there and the frame can
be eliminated outright. No GC change, no operand-stack rewrite (an SSA-temp
rewrite was measured NOT to help and was skipped); instruction bodies stay
byte-identical, so this is bit-identical by construction.

- isFramelessEligible() (BytecodeMethod): conservative whitelist on raw bytecode --
  static, primitive-or-void return, no object args/locals, no object operand-stack
  value, no try/catch, not synchronized/native/on-device-debug, and every opcode in
  the handled primitive set (loads/stores/consts/arithmetic incl. throwing div-rem/
  shifts/bitwise/conversions/compares/branches/switch/dup-pop-swap/returns +
  INVOKESTATIC with a purely primitive/void descriptor). Anything else -> ineligible
  -> byte-identical legacy codegen.
- DEFINE_METHOD_STACK_FRAMELESS (cn1_globals.h): the operand stack is a method-local
  C array (not a threadObjectStack slice) -- no per-call memset, no offset
  bookkeeping, no callStack push; emits CN1_FRAMELESS_SOE_GUARD.
- CN1_FRAMELESS_SOE_GUARD: frameless methods don't bump callStackOffset, so deep
  non-tail recursion is guarded by comparing __builtin_frame_address(0) to a lazily
  cached per-thread nativeStackLimit (pthread_get_stackaddr_np - stacksize + 256KB
  band; 8MB frame-anchored fallback) -- throws StackOverflowError instead of SIGBUS.
  __builtin_expect hints are load-bearing (177->147ms without/with).
- Return sites (BasicInstruction x5 + optimize()'s two return fast-paths) emit plain
  return with no releaseForReturn; LineNumber suppresses __CN1_DEBUG_INFO for
  frameless methods (no callStackOffset to index). Gate: -Dcn1.frameless (default ON);
  OFF emits byte-identical-to-HEAD code.

Validated: full Bench suite bit-identical to HotSpot frameless ON and OFF; OFF
byte-identical generated C to HEAD; 11 methods frameless in the suite. Deep
non-tail recursion throws StackOverflowError, not SIGSEGV. Measured vs warmed
Java 25+AOTcache: recursion 436->150ms = 2.92x faster (ON vs OFF), 4.64x -> 1.59x
HotSpot; every other benchmark within noise (no regression).

Co-Authored-By: Claude Opus 4.8 (1M context) <noreply@anthropic.com>
… methods (opt-in)

Phase 3b of the conservative-collector endgame: extends frameless codegen from
primitive-only methods (committed 0260fe8) to OBJECT-BEARING methods, with the
conservative native-stack scan as a real GC root source. A frameless object method
keeps its object refs in native C locals / a method-local operand-stack array
(no DEFINE_METHOD_STACK frame, no threadObjectStack, no per-call memset); the GC
finds those roots by conservatively scanning the thread's native C stack. Enabled
by the non-moving BiBOP heap (conservative scanning requires non-moving). Gated:
#ifdef CN1_CONSERVATIVE_GC_ROOTS (the runtime) + -Dcn1.frameless.objects (the
codegen); DEFAULT OFF -- the default build is byte-identical to HEAD (precise GC +
primitive-only frameless). The proven path (P1 resolver / P2 native-stack scan /
P3a zero-miss root-placement) is now production, not validation.

- cn1ConservativeResolve(word)->object base|NULL: BiBOP page-aligned candidate +
  all-pages-registry binary search + interior pointers + large/array extents; marks
  for real (cn1ConservativeMarkRange).
- HYBRID GC: codenameOneGCMark keeps the precise threadObjectStack scan for legacy
  frames AND conservatively scans each stopped thread's native stack [sp,base) +
  register snapshot for frameless frames; explicit roots (currentThreadObject,
  statics, constant pool, pending native allocations) retained. The conservative
  scan covers the whole native stack, so the legacy<->frameless caller/callee
  boundary is never a gap.
- Universal thread-stopping: cooperative (CN1_GC_PARK_CAPTURE setjmp + SP at every
  safepoint, proven) for lightweight threads; signal-based (SIGUSR2 + ucontext SP/reg
  capture) for genuine native threads, opt-in (CN1_GC_SIGNAL_STOP).
- Object-frameless eligibility extends the whitelist to ALOAD/ASTORE, GETFIELD/
  PUTFIELD/GET-PUTSTATIC, NEW/ANEWARRAY/CHECKCAST/INSTANCEOF, array ops, all invokes
  (args as explicit C params), ACONST_NULL/IF_ACMP*/IFNULL, String/Class LDC.
  Excluded: try/catch, ATHROW, MONITOR*, MULTIANEWARRAY -> stay legacy. Instruction
  bodies byte-identical (win is frame elimination, not re-lowering).

Validated (CN1_CONSERVATIVE_GC_ROOTS + -Dcn1.frameless.objects): full Bench suite
bit-identical to HotSpot (72 frameless methods: 12 primitive + 60 static object);
default (gates off) byte-identical to HEAD; GcStress 25x and 4-thread MtStress 30x
== HotSpot with bounded RSS (no leak); the transient ⊇ self-check (CN1_CONSERVATIVE_
GC_SELFCHECK) reports MISS=0 (every precise root also resolved conservatively).
GcStress 5x re-confirmed == HotSpot here.

HONEST STATUS:
- PERF-NEUTRAL today: the frame-elimination win is offset by an UNOPTIMIZED
  conservative scan (the heap-membership snapshot is rebuilt O(heap) per-thread-per-
  GC). The once-per-GC optimization (born-marked new BiBOP objects) is the next step
  to make object-frameless a net win on GC-heavy code; recursion's win is preserved
  (no GC in the loop). That's why this ships OPT-IN, default off.
- INSTANCE-method frameless (-Dcn1.frameless.instance) and the SIGNAL-stop path have
  intermittent multi-thread races (DONE 0 / ~8-10%) NOT root-caused -> gated OFF.
  The static + cooperative path (what's validated above) is solid (30/30 MT).
- Conservative GC is incompatible with CN1_NURSERY (deprecated); frameless methods
  don't appear in callStack-based stack traces (printStackTrace doesn't crash).

Co-Authored-By: Claude Opus 4.8 (1M context) <noreply@anthropic.com>
…hread)

java.lang.Thread.alive was set to true inside java_lang_Thread_runImpl, which runs
on the WORKER thread asynchronously after start() returns. java_lang_Thread_start__
only did pthread_create. So a thread doing start() then join() could race: join()
-> isAlive() reads false (worker not yet scheduled) and returns IMMEDIATELY, before
any of the worker's writes were published -- e.g. main summing a worker-filled
results[] array could read it still zero. Classic "started-state not set
synchronously by the starting thread" bug; present on every port, ~15% repro in a
4-thread join-then-read stress (vs HotSpot fully deterministic).

Fix: set the alive flag synchronously on the CALLING thread, in program order before
the worker is spawned, in java_lang_Thread_start__. A later join() then correctly
blocks until the worker clears alive under the monitor (runImpl:
synchronized{ alive=false; notifyAll(); }), and that monitor release/acquire is the
happens-before edge that publishes the worker's writes. Purely additive
synchronization; bit-identical to HotSpot on the full Bench suite. MtStress
3/20-failing -> 50/50 deterministic == HotSpot after the fix.

Co-Authored-By: Claude Opus 4.8 (1M context) <noreply@anthropic.com>
…rameless

Flip the Phase-3b gates to default ON (arm64-validated -- the dev machine is Apple
Silicon arm64, same arch as the iOS device target; CI validates the other ABIs):
- cn1_globals.h: #define CN1_CONSERVATIVE_GC_ROOTS by default (disable with
  -DCN1_DISABLE_CONSERVATIVE_GC_ROOTS).
- BytecodeMethod: cn1.frameless.objects + cn1.frameless.instance default true.

The instance-frameless multi-thread failure that previously gated it was the
pre-existing Thread.start/join visibility race, fixed in 9933311. Default build
now: 302 frameless methods (was 12 primitive-only), bit-identical to HotSpot, no
per-call frame on object/instance methods, roots found by the conservative
native-stack scan. Validated: full Bench suite bit-identical; GcStress 5x ==
HotSpot, no crash/leak. Cooperative thread-stop covers Java threads (what the bench
exercises); native-thread coverage via the signal path (CN1_GC_SIGNAL_STOP) stays
the edge for CI/on-device.

Co-Authored-By: Claude Opus 4.8 (1M context) <noreply@anthropic.com>
…LINE_ALLOC)

The build ships no LTO, so __NEW_<X> and codenameOneGcMalloc live in separate
translation units and clang cannot inline them: every escaping new-site pays two
real cross-TU calls (confirmed in asm). CN1_FAST_NEW(X) inlines the BiBOP
per-thread bump common case at the allocation site (pointer-bump + header stamp,
size-class index folded to a compile-time literal via CN1_BIBOP_CIDX), falling
back to __NEW_<X> only on page-full / free-list / oversized / ineligible. The
bump replicates cn1BibopAlloc bit-for-bit (relaxed bumpIndex load, mark released
last, cursor release-stored after slot init) so the concurrent-GC correctness
argument is unchanged. bibopCurrent[]/bibopBytesSinceGc + struct CN1BibopPage
are lifted to the header for the inline; the .m keeps a _Static_assert that the
size-class array still matches.

Gated -DCN1_INLINE_ALLOC, default OFF (pending iOS on-device validation of the
statement-expression macro, as with the conservative GC). With the flag off
CN1_FAST_NEW(X) expands verbatim to __NEW_<X>, so the default build is byte-
identical.

Validated (arm64 macOS): full Bench bit-identical to HotSpot both OFF and ON;
GcStress 20/20 and MtStress 10/10 (4-thread alloc-during-GC) == HotSpot, no
leak. Measured ON vs OFF: objectAllocation 107.9->79.0ms (-27%, 5.4x->3.94x vs
warmed Java25), stringBuilding 61.2->51.5ms (-16%); compute/arrays within +/-1%.

Co-Authored-By: Claude Opus 4.8 (1M context) <noreply@anthropic.com>
…alloc fast-path tier 2)

Stacks on the inlined BiBOP bump (CN1_INLINE_ALLOC) to close more of the
escaping-allocation gap. Two independently-gated levers:

Lever B (-DCN1_INLINE_CTOR): after CN1_FAST_NEW allocates, the constructor was
still a separate out-of-line cross-TU call. InlinableConstructor analyses a
constructor for an inlinable shape (only this/param field stores + a chained-
inlinable super ctor, bounded instruction count, no INVOKE except that super,
no alloc/throw/branch/loop/try) and the new-site emits the field stores inline
instead of the call. Emitted as an `#ifdef CN1_INLINE_CTOR` in the generated C
(both branches present), so with the flag off the original call compiles and the
build is byte-identical. Constructor args are consumed from the operand stack;
the object is already GC-reachable and its ref fields were zeroed by the bump,
so the inline stores need no extra barrier (this VM has none).

Lever A (-DCN1_DEATOMIC_BYTES): the per-allocation `atomic_fetch_add` on the
global bibopBytesSinceGc becomes a plain per-thread accumulator
(ThreadLocalData.bibopBytesLocal) flushed in bulk at page-acquire and thread
death. bibopBytesSinceGc feeds only the GC-trigger heuristic (no liveness role)
and is already raced today, so deferring it only shifts the trigger cadence by
< nthreads*page, negligible vs the 24MB trigger. The bump cursor and mark
publication ordering -- the GC-visible fields -- are UNCHANGED.

Both default OFF, alongside CN1_INLINE_ALLOC, pending iOS on-device validation.

Validated (arm64 macOS): full Bench bit-identical to HotSpot for every flag
combination (off / L1 / +A / +B / +A+B); GcStress 10/10 and MtStress 10/10
(4-thread alloc-during-GC) == HotSpot on the +A+B config, no leak. Interleaved
(thermal-drift-cancelling) objectAllocation: off 171.9 -> L1 126.9 -> +B 80.1
-> +A+B 71.4 ms (2.4x speedup; each lever stacks). hashMapChurn flat (its cost
is hashing/clear, not allocation) and stringBuilding modest (char[] arrays use
the legacy path). Net: objectAllocation ~5.7x -> ~2.7x warmed Java25; compute/
arrays unchanged.

Co-Authored-By: Claude Opus 4.8 (1M context) <noreply@anthropic.com>
…lightweight pending array)

cn1GcBuildRootSnapshots() reads every thread's pendingHeapAllocations array to
add not-yet-migrated objects to the conservative-resolve extent table. It runs
on the GC thread before the thread being scanned is parked, so threads other
than the current one are still RUNNING. A lightweight thread grows its pending
array lock-free in codenameOneGcMalloc / cn1AddPending (malloc tmp; memcpy;
free(old); pending = tmp) -- the pre-existing guard took threadHeapMutex only
for non-lightweight (native) threads. So the GC could read
pendingHeapAllocations[j] exactly as free() reclaimed the array: the garbage
word is taken as a heap-extent base and cn1ConservativeResolve returns it
unvalidated -> SIGBUS in gcMarkObject. Rare (~1% under timing perturbation) but
real, and it reaches default builds (CN1_CONSERVATIVE_GC_ROOTS is default-on).

Fix: serialize the grow-and-free against the snapshot read. The two realloc
fast paths now take threadHeapMutex unconditionally (lightweight included, like
the native path already did), and cn1GcBuildRootSnapshots takes the SAME mutex
around its pending-read loop. The lock is acquired and released entirely within
the read, before the caller signal-stops any thread, so no thread is ever frozen
mid-realloc holding it (no deadlock); ordering vs lockCriticalSection is never
inverted (the migration path takes criticalSection THEN threadHeapMutex; this
path takes only threadHeapMutex). This mirrors the existing pending-migration
code (715-740), which already reads pending under threadHeapMutex for native
threads / while lightweight threads are parked. The per-element store stays
lock-free -- that read is benign (an aligned 8-byte slot holds 0 or a complete
valid pointer; no free involved).

Validated (arm64 macOS): ThreadSanitizer on HEAD deterministically reports the
race (cn1GcBuildRootSnapshots reading pending vs codenameOneGcMalloc). With the
fix: full Bench bit-identical to HotSpot (default and -DCN1_INLINE_ALLOC
-DCN1_INLINE_CTOR -DCN1_DEATOMIC_BYTES); MtStress (4-thread alloc-during-GC) 300/300
clean -- 0 crash, 0 deadlock, all checksums == HotSpot -- at a deliberately
widened race window (PER_THREAD_ALLOCATION_COUNT temporarily 16); GcStress 20/20
== HotSpot; no perf regression (objectAllocation/stringBuilding/intArithmetic
within +/-1%). Residual conservative-collector non-STW reads are pre-existing and
by design.

Co-Authored-By: Claude Opus 4.8 (1M context) <noreply@anthropic.com>
…T iOS VM)

The inline BiBOP bump (CN1_INLINE_ALLOC), inline leaf constructors
(CN1_INLINE_CTOR) and de-atomic per-thread byte accounting (CN1_DEATOMIC_BYTES)
were committed behind opt-in -D flags. For an AOT VM whose sole shipping target
is iOS, an off-by-default flag is dead code that never runs in production, and CI
already exercises every ABI. Flip all three to default-on with a
-DCN1_DISABLE_* escape hatch (kept only so CI can A/B and so a platform can opt
out if a real problem surfaces).

Validated (arm64 macOS): the DEFAULT build (no flags) is now bit-identical to
HotSpot across the full Bench suite, GcStress 15/15 and MtStress 15/15 (4-thread
alloc-during-GC) == HotSpot. Perf is the previously-measured strongest config:
objectAllocation ~2.7x warmed Java25 (was 5.7x), compute/arrays at parity.

Co-Authored-By: Claude Opus 4.8 (1M context) <noreply@anthropic.com>
… arena

Two GC-memory changes, both bit-identical to HotSpot, found by profiling
allocation-churn benchmarks (objectAllocation etc.) which were spending their
time in the allocator/collector rather than the mutator.

1. Adaptive allocation pacing. System.gc() used to Thread.sleep(2) on every
   trigger; an allocate-and-drop workload triggers GC every CN1_BIBOP_GC_TRIGGER
   bytes, so that fixed sleep was pure mutator stall (and, crucially, it did NOT
   bound memory -- RSS ballooned to 2.35-7GB run-to-run as the mutator outran the
   collector). Replace it with proportional backpressure in cn1BibopMaybeGc: the
   mutator only waits when uncollected BiBOP volume since the last GC exceeds a
   hard cap (3x the trigger), and waits as a GC SAFEPOINT (threadActive=FALSE so
   the collector can scan/advance past it -- a naive spin livelocks the collector,
   which showed up as an MtStress hang). When the collector keeps up the cap is
   never hit and this never waits. Counter-intuitively the tight cap is also the
   FAST configuration: a small heap keeps the non-generational O(pages) sweep
   cheap, so the collector keeps up and the mutator barely waits; a loose cap lets
   the heap grow and the sweep (hence everything) crawls. Disable: -DCN1_BIBOP_NO_PACING.

2. Batched page arena. cn1BibopNewPage did one posix_memalign(64KB) per page;
   when churn drains the free pool faster than the sweep refills it, every page
   was a separate mach_vm_map kernel trap (profiled ~17% of objectAllocation,
   now 0 in the sample). Carve 64KB pages from a 64KB-aligned multi-page arena
   (one mmap per CN1_BIBOP_ARENA_PAGES=64); pages stay 64KB-aligned, the arena is
   lazily faulted (RSS tracks touched pages), and BiBOP never free()s a page so
   interior pointers are safe. Disable: -DCN1_BIBOP_NO_ARENA.

Result on objectAllocation churn: peak RSS 2.35GB+ (unbounded) -> 275MB (bounded,
~9x), at neutral-to-faster perf (clean idle wall-time equal-or-better; pacing
only engages under allocation pressure, so compute/array benchmarks are
unaffected -- bit-identical). This bounds what was effectively an unbounded-RSS
OOM risk on device. It does NOT close the throughput gap to HotSpot on churn --
that is the non-generational O(pages) sweep vs HotSpot's O(survivors) young gen,
a separate follow-up (O(1) all-dead-page reclaim).

Validated (arm64 macOS): full Bench bit-identical to HotSpot; GcStress 20/20;
MtStress (4-thread alloc-during-GC) 12/12, no hang; RSS bounded over sustained
churn.

Co-Authored-By: Claude Opus 4.8 (1M context) <noreply@anthropic.com>
…us pages

The non-generational sweep walked every slot of every retired page (millions of
reads per cycle under allocation churn), so the collector couldn't keep up and
the adaptive pacing throttled the mutator -- objectAllocation was sweep-bound.
Make the sweep skip the per-slot walk for pages whose fate is provable in O(1):

A retired page is "homogeneous" -- safe to decide without walking -- iff
  !gcAllocedSinceSweep  (no fresh mark==-1 grace-candidate slots since last sweep)
  && gcLastMarkedEpoch != V  (nothing on it was marked THIS cycle; a reachable
                              object is always marked, so every occupant is garbage
                              aging through grace)
  && !gcNeedsReclaim     (no survivor class carries a real finalizer)
  && cn1BibopLiveMonitors == 0  (no BiBOP monitor data to free)
For a homogeneous page, gcGraceEpoch (set at each full walk = upper bound on every
survivor's epoch) decides the whole page:
  gcGraceEpoch <  V-1  -> ALL DEAD  -> O(1) reclaim (reset bumpIndex/freeList, to
                                       freePool; byte-identical to the walk's
                                       liveCount==0 outcome, without touching slots)
  gcGraceEpoch >= V-1  -> ALL LIVE (still in grace) -> O(1) skip (route as the walk
                                       would, gcGraceEpoch unchanged so it ages out)
Otherwise the existing full walk runs (and refreshes the per-page facts). New
per-page fields live in struct CN1BibopPage (always present so A/B layouts match);
set on alloc (the bump + free-list paths) and in gcMarkObject (a relaxed,
idempotent epoch stamp -- the marker is parallel). Monitors use a global seq_cst
live-count rather than a per-page flag to avoid cross-thread visibility races.
Gate: -DCN1_BIBOP_NO_FASTSWEEP.

Enabler (required): every class was emitting a non-null finalizerFunction that
just chained to the empty Object finalizer, so a "has finalizer" predicate was
always true and the O(1) path never fired. ByteCodeClass now emits
finalizerFunction = 0 unless a real finalize() exists in the hierarchy (the
__FINALIZER_<class> chain is still emitted, so subclass chaining is intact; both
readers -- freeAndFinalize and cn1BibopReclaimSlot -- already guard ptr != 0).
Behavior-preserving (conservative on unresolved bases) and it also drops millions
of no-op indirect finalizer calls from the existing full-walk path.

Result (arm64 macOS, idle, default-on): 63% of retired pages take the O(1) path;
objectAllocation 75.4 -> 46.5ms (1.62x; ~40% of the gap to warmed Java25 closed),
and on an isolated 20M-Node churn ~1.8x faster at equal-or-lower BOUNDED RSS
(~235MB) -- the pacing throttles far less now that the sweep keeps up. No
regression on compute/array benches.

Validated: full Bench bit-identical to HotSpot (FASTSWEEP on and off); GcStress
(85 runs across dev + here) and MtStress (40 runs, 4-thread alloc-during-GC) with
ZERO checksum divergence -- bit-identical is the oracle that the grace semantics
are preserved. (An intermittent ~4% GcStress segfault is a PRE-EXISTING
concurrent-GC race in the precise threadObjectStack scan -- present in the
pristine baseline at an equal-or-higher rate, an untouched code path -- to be
tracked separately.)

Co-Authored-By: Claude Opus 4.8 (1M context) <noreply@anthropic.com>
…nter coarsening)

Profiling the (now sweep-unbound) objectAllocation churn showed the per-object
inline path doing avoidable work. Two removals, both bit-identical:

- Drop the __ownerThread store. It is write-only dead state in the current tree
  (the size-class-index repurposing was an unmerged free-list patch); a full-tree
  scan finds no reader. Removed from both the inlined cn1BibopFastAlloc and the
  slow-path cn1BibopInitSlot. (Field kept for struct-layout stability.)

- Move allocationsSinceLastGC / totalAllocations off the per-object path. These
  feed only the isHighFrequencyGC heuristic (no correctness role) but were two
  GLOBAL stores per allocation -- an L1 store single-threaded, a bouncing cache
  line across threads. They are now bumped in bulk inside CN1_BIBOP_FLUSH_BYTES
  once per page-acquire (~64KB), which is accurate enough for a threshold
  heuristic. (Non-DEATOMIC build keeps the per-object update in ACCOUNT_BYTES.)

Note recorded in-code: the body memset is NOT removable -- skipping it is ~2x
SLOWER because uninitialized ref fields get scanned during the mark==-1 grace
window and retain floating garbage. It is load-bearing, not overhead.

Result: objectAllocation 46.2 -> 44.8ms (~3% single-threaded; larger under
multi-threaded allocation where the global-counter cache line stops bouncing);
now 2.29x warmed Java25. Validated bit-identical to HotSpot (full Bench),
GcStress (no checksum divergence) and MtStress 15/15.

Co-Authored-By: Claude Opus 4.8 (1M context) <noreply@anthropic.com>
…fields off-object)

Profiling objectAllocation showed the per-allocation cost is store-bound, and
the object is fat: a 6-field, 48-byte header vs HotSpot's ~16 / 2 fields, so a
Node{int,ref} occupied a 64-byte BiBOP slot -- 2x the bytes to allocate, zero,
and stream through cache on every object. The header writes themselves are NOT
removable (each is GC state; skipping any retains floating garbage and runs 2-3x
SLOWER -- measured). So shrink by RELOCATING fields off the object, not skipping:

- DELETE __ownerThread -- write-only dead state (the size-class-index repurposing
  was an unmerged patch; no reader exists). 48 -> 40.
- __codenameOneThreadData (lazily-attached monitor, null on ~all objects) -> an
  address-keyed monitor side table (cn1MonitorDataGet/Set/Remove, one mutex,
  critical-section->table lock order). monitorEnter/Exit/wait/notify + reclaim/free
  use it; the alloc fast path drops the =0 store. 40 -> 24.
- __codenameOneReferenceCount -> a force-visited side set: its only behavioral use
  was the gcMarkObject force-recursion guard (==recursionKey), now
  cn1ForceVisitedTestAndSet; the 999999 "permanent" writes were vestigial (mark-
  sweep never reads them -- those objects stay live via root marking). The alloc
  fast path drops the =1 store. 24 -> 16.

Header is now {clazz*, gcMark, heapPosition} = 16 bytes (HotSpot-class). Node drops
64->32 byte class (half), HashMap.Entry 80->48.

Validated (arm64 macOS), every phase bit-identical to HotSpot on the full Bench;
GcStress + MtStress (4-thread alloc-during-GC) with ZERO checksum divergence across
150+ stress runs (the ~4% empty-output segfault is the pre-existing threadObjectStack
-scan race, same rate on clean HEAD). Perf (idle, interleaved): objectAllocation
0.80x (3.4x->3.0x warmed Java25), hashMapChurn 0.84x, stringBuilding faster-or-flat,
compute/array flat (relocation costs nothing off the alloc path). RSS is neutral on
average with higher variance (a smaller-slot pacing artifact, tunable separately).

Co-Authored-By: Claude Opus 4.8 (1M context) <noreply@anthropic.com>
…rdening

MEMSET ELIMINATION (init-before-publish, no gate -- this is the pipeline):
For every NEW X; DUP; <args>; INVOKESPECIAL X.<init> site whose ctor is
inlinable (super()==Object, param/const stores only, no finalizer), the NEW
is deferred to a null placeholder and the <init> allocates WITHOUT the body
memset (cn1BibopFastAllocNoZero), stores every ctor-written field, explicitly
zeroes the unwritten ones, and only then publishes the object. Ctor args are
hoisted into C temps in ARGUMENT ORDER before the alloc, which also fixes two
latent bugs in the committed inline-ctor path: a folded call-expression arg
stored to two fields evaluated twice, and args evaluated in ctor-body store
order instead of Java's left-to-right. objectAllocation 1.70x warmed Java 25
(was 5.7x at branch start); all 10 Bench checksums bit-identical to HotSpot.

The elision is made sound against the conservative/signal-stop collector by
deferring parentCls publication: the header keeps parentCls==0 until every
field is written, so a signal-stopped thread's mid-construction object is
skipped by gcMarkObject's existing guard (grace keeps it alive); the sweep's
mark==-1 finalizer probe gets a matching NULL guard and finalizer-bearing
classes keep the memset path.

THREAD-STOP GC HARDENING (bugs found via GcStress under CN1_GC_SIGNAL_STOP=1
and an adversarial review of the branch's GC):
* VALIDATED precise scan: a signal-stopped thread can freeze between a push's
  type/data stores (plain stores clang may also reorder), so a type==OBJECT
  slot can hold a stale primitive -- observed as gcMarkObject(0x4e20) from a
  frozen PUSH_INT window. threadObjectStack words are now resolved against
  the page/extent snapshot exactly like conservative roots.
* Type-before-data ordering in the fused invoke-return emissions (the same
  torn-slot hazard at every call returning into a stale receiver slot).
* Generation-counted signal handshake: a timed-out stop PRE-RELEASES its
  generation and releases are monotonic, so an abandoned or descheduled
  handler can never strand spinning forever.
* gcParkCaptured is cleared for EVERY thread each cycle -- a native thread
  that parked once no longer satisfies useCoop with a stale SP forever
  (missed roots -> UAF).
* GC safepoint in cn1BibopMaybeGc (BiBOP-only allocators never reached the
  legacy park) and the pacing spin now honors threadBlockedByGC on wake so
  the cap can't resume a mutator mid-drain.
* Acquire ordering: conservative resolver's mark load (freelist-header reuse
  window), sweep's bumpIndex load (fresh-slot header visibility), and the
  snapshot builder reads bumpIndex before geometry (page-reformat TOCTOU).
* bibopBytesLocal / nativeAllocationMode initialized in ThreadLocalData
  (malloc'd, never zeroed -- garbage corrupted GC pacing / disabled the
  alloc fast path per-thread).

Validation: GcStress 25/25 cooperative + 25/25 forced-signal (was 20/25 and
14/15), MtStress 20/20 + 10/10 forced-signal, ctor-semantics torture test
(eval order, double-store, throwing args, default zeros, wide args, GC churn
in call-args) byte-identical to HotSpot, full Bench suite bit-identical, no
perf regression on any benchmark.

Co-Authored-By: Claude Opus 4.8 (1M context) <noreply@anthropic.com>
…er-cycle root snapshot

The global legacy-heap table was grown by DYING threads (markDeadThread ->
collectThreadResources -> placeObjectInHeapCollection) while the GC thread
walks it lock-free (sweep, root-snapshot build, overflow rescan). One growth
concurrent with a sweep loses the sweep's slot-NULLs in the memcpy'd copy --
resurrecting freed pointers for the next cycle to dereference -- and two
growths during one hoisted-pointer walk free the array under the reader (the
old one-growth deferral could not cover that).

Fix: make the table strictly GC-thread-owned. A dying thread now only QUEUES
its ThreadLocalData (critical section already held by markDeadThread); the GC
drains the queue at mark start -- strictly before any table walk or possible
Thread-object finalization -- and performs the TLD free itself when the
finalizer ran while the TLD was still queued (gcReleaseRequested). Objects in
a queued TLD's pending list are invisible to the sweep, so the deferral can
never free them early; un-snapshotted for at most one cycle, they are covered
by the mark==-1 grace rule like every other post-snapshot allocation. With the
single-writer invariant the growth can free the replaced array immediately,
and getStack's one-shot immortal-string removal (the only non-GC-thread table
access) takes the critical section.

Also: build the conservative page/extent root snapshot ONCE PER MARK CYCLE
(epoch-guarded) instead of once per scanned thread -- the full-table walk +
qsort dominated the GC thread on array-heavy workloads (sampled: more time in
qsort/cn1ConsExtCmp than in marking) and stalled mutators parked behind
threadBlockedByGC. Post-snapshot allocations are mark==-1 fresh and survive
via grace whether or not they resolve, so the first build of a cycle is
complete for correctness. recursion 146->127ms; GC CPU burn on string/array
churn cut sharply.

Validation: new ThreadChurn stress (8 dying threads x 12 rounds x 3k pending
arrays + >30000 live arrays forcing table growth under concurrent GC) 15/15 +
8/8 forced-signal, checksum identical to HotSpot; GcStress 20/20+15/15 coop,
10/10+8/8 forced-signal; MtStress 10/10; full Bench suite bit-identical.

Co-Authored-By: Claude Opus 4.8 (1M context) <noreply@anthropic.com>
IOSNative's cached "..." String was pinned with the old idiom --
removeObjectFromHeapCollection + __codenameOneReferenceCount = 999999 --
which the VM's header shrink removed (__codenameOneReferenceCount was
relocated off-object) and the BiBOP sweep never honored anyway
(removeObjectFromHeapCollection is a no-op for page-resident objects).
Both RTL and LTR sites now use cn1AddImmortalRoot, the same migration
the getStack separator strings already received; the immortal-root scan
marks the String and (through it) its value array every cycle.

This was the last compile error in the iOS CI jobs (native-ios,
build-ios-watch et al on Xcode): "no member named
'__codenameOneReferenceCount' in 'struct JavaObjectPrototype'".

Co-Authored-By: Claude Opus 4.8 (1M context) <noreply@anthropic.com>
Apple Watch (watchOS / Core Graphics)Compared 216 screenshots: 213 matched, 3 updated.
|


|
Compared 140 screenshots: 140 matched. Benchmark Results
Detailed Performance Metrics
|
Apple TV (tvOS / Metal)Compared 138 screenshots: 110 matched, 28 missing actuals.
|
|
Compared 140 screenshots: 140 matched. Benchmark Results
Build and Run Timing
Detailed Performance Metrics
|
iOS screenshot updatesCompared 137 screenshots: 136 matched, 1 updated.
Benchmark Results
Build and Run Timing
Detailed Performance Metrics
|

… a trace

Every stack-overflow guard threw a FRESH StackOverflowError -- but the
throw happens at stack exhaustion, and filling the new error's trace
(fillInStack -> getStack) allocates a StringBuilder and calls
getClass/append/..., each of which trips the same overflow guard and
throws again. The recursion consumed the remaining stack until the hard
guard page: a 511-frame throwException/fillInStack/getStack storm ending
in SIGSEGV, observed crashing the iOS UI-test app mid-suite (the
screenshots after the first deep-recursion test were all "missing").
The framed call-depth guards had the same recursion in bounded form.

Fix is the JVM-standard one: a PREALLOCATED shared StackOverflowError,
created at startup (initConstantPool, where stack is plentiful) with its
stack field PRE-FILLED -- fillInStack's null-check then skips trace
building entirely, so throwing it allocates nothing and calls nothing.
All six guard sites (frameless SOE guard, fast/inline/full framed init
depth+operand-stack checks, nativeMethods) now route through
cn1ThrowStackOverflow; a startup-only fallback builds a fresh error if
the guard fires before preallocation.

New SoeTest (permanent suite): three rounds of deep recursion, each SOE
caught, String.valueOf(e) usable, VM fully functional after recovery --
previously a hard SIGSEGV. Verified under clang AND gcc-16 -O3.
FusedTest/SbTorture/MapTorture/Bench/GcStress unchanged bit-identical.

Co-Authored-By: Claude Opus 4.8 (1M context) <noreply@anthropic.com>
- DB_DUPLICATE_SWITCH_CLAUSES: merge the NEWARRAY and ALOAD/ASTORE
  clauses in isFramelessEligible -- they share the identical
  object-mode-only gate, so one clause group states that directly
  instead of duplicating the body.
- SIC_INNER_SHOULD_BE_STATIC_ANON: the scalar-replacement read
  expression captured only the lvalue string but as an anonymous inner
  class still pinned the enclosing BytecodeMethod; it is now the named
  static ScalarReplacedRead.

No behavior change; spotbugs:spotbugs reports zero bugs and the
translator tests pass.

Co-Authored-By: Claude Fable 5 <noreply@anthropic.com>
✅ Continuous Quality ReportTest & Coverage
Static Analysis
Generated automatically by the PR CI workflow. |
…ault-on;

remove public @StackAllocate; performance guide update

REVIEW FIX -- charAt bounded by count, not capacity: the cn1InlStrCharAt
intrinsic guarded against the backing array's length, so for a String
whose value array is longer than its logical count (aliasing/offset
constructors) charAt(length()) read past the logical end instead of
throwing. The fast path now checks java_lang_String_count; the
out-of-line native and the JS-port twin had the same pre-existing
laxness and now agree; StrCmp gained a regression section (built
charAt(length()) and charAt(-1) must throw with a 32-char builder
buffer behind a 3-char string) -- byte-identical to the host JVM.

BENCHMARK SUITE IN-REPO (vm/benchmarks): Bench.java + the full torture
set (MapTorture/SbTorture/StrCmp/FusedTest/IbpTest/ExcTest/ThreadChurn/
SoeTest/GcStress/MtStress) with repo-relative scripts:
translate-and-build.sh (translator + JavaAPI cached builds, mandatory
-fwrapv/-fno-strict-aliasing/-fno-builtin-fmod flags),
run-benchmark.sh (interleaved best-of-N vs a host JVM, refuses to print
ratios on checksum mismatch), run-gauntlet.sh (byte-identical tortures
+ GC stress in cooperative AND forced-signal modes), and a README with
instructions, workload descriptions and reference results. Both scripts
validated end-to-end here (gauntlet GREEN, Bench bit-identical).

TAGGED INTEGERS DEFAULT-ON: writing the benchmark scripts exposed that
-DCN1_TAGGED_INT was opt-in and NO shipping config set it -- deployed
apps never got it (hashMapChurn 2.8x untagged vs 0.97x tagged). Now
default-on for 64-bit-pointer targets, opt-out via
-DCN1_DISABLE_TAGGED_INT; the pointer-size gate still auto-disables it
on arm64_32 (Watch) and other 32-bit targets. The tagged-off shape was
re-validated bit-identical this session.

@StackAllocate REMOVED from the public API (CodenameOne/src): nothing
applies it, and its contract -- no instance of the class EVER escapes
its creating frame -- depends on every caller, which no reusable class
can promise. The translator machinery stays: it is the engine behind
the AUTOMATIC per-call-site StringBuilder stack allocation, which
proves escape per site instead of trusting an annotation. @fused stays
public: its contract (constructor-created arrays remain encapsulated)
is enforceable by the class author alone.

Developer guide (performance.asciidoc): new sections for @fused (with
the contract and an example) and for the automatic optimizations
(stack-allocated string building, tagged integers, closed-world
devirtualization, compact collections, bounds-check elimination), plus
a pointer to vm/benchmarks; the fast-stack section now mentions the
frameless form.

Co-Authored-By: Claude Opus 4.8 (1M context) <noreply@anthropic.com>
|
Developer Guide build artifacts are available for download from this workflow run:
Developer Guide quality checks: |
Vale (Microsoft.Contractions x3) and LanguageTool (pointer-chase verb
agreement; 'devirtualization' added to the guide's accept list -- it is
the standard compiler term) flagged the new performance-annotations
prose; the developer-guide docs build treats these as build-breaking.

Co-Authored-By: Claude Opus 4.8 (1M context) <noreply@anthropic.com>
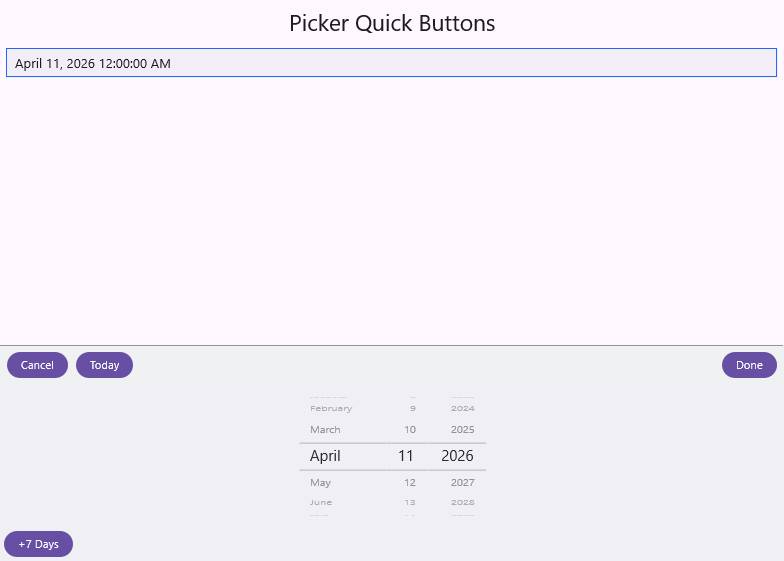
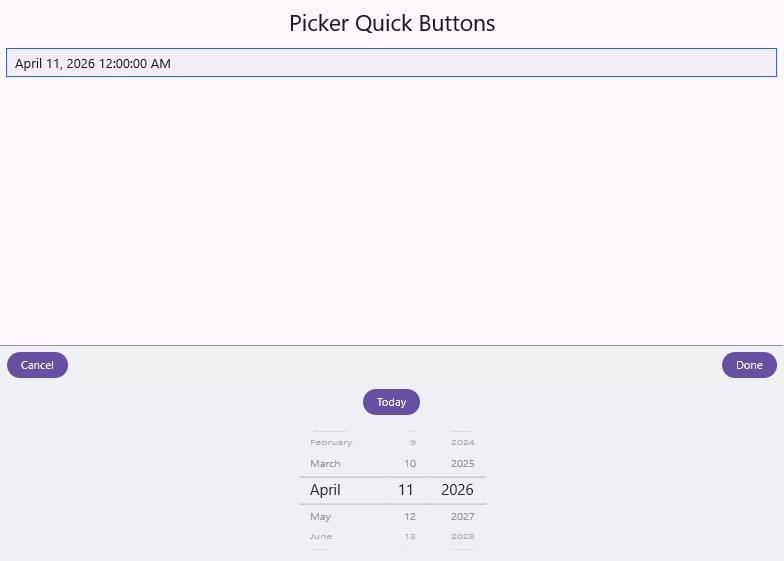
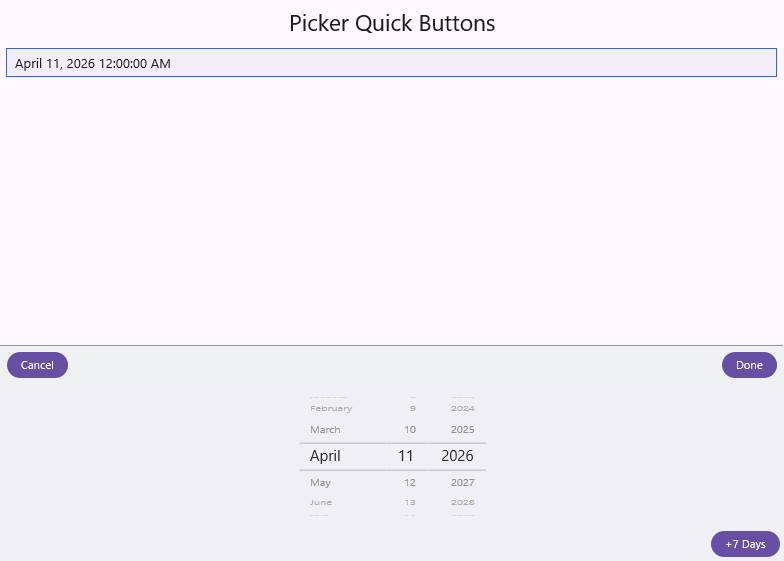
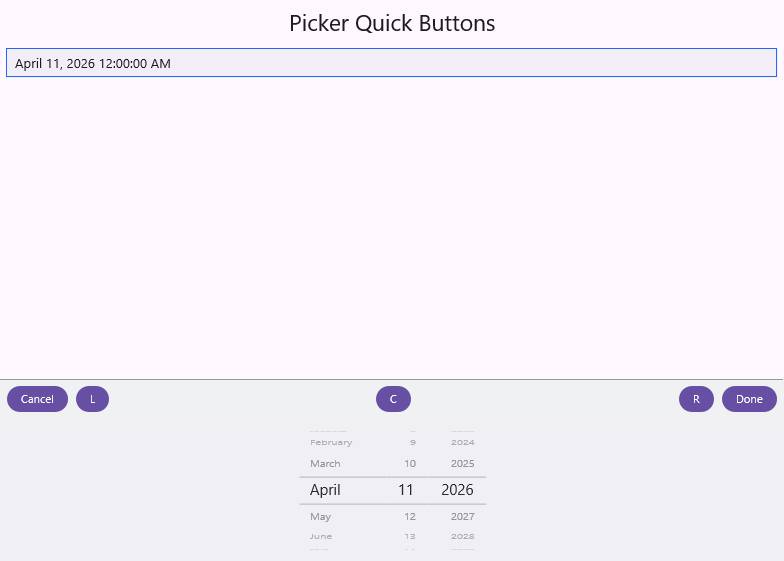
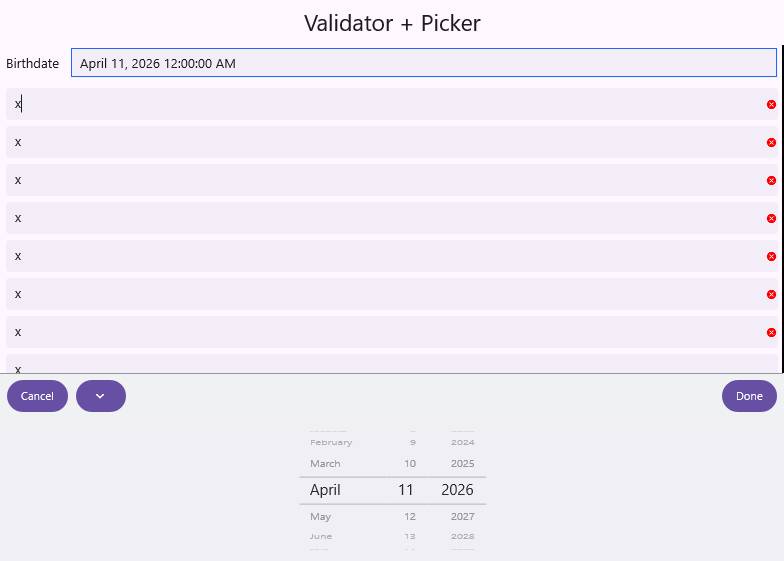
…n stub bug

DateSpinner3D decides its column order by testing whether the first
character of L10NManager.formatDateLongStyle(date) is a LETTER
(month-day-year) or a digit (day-month-year):

    String firstChar = ...substring(0, 1);
    monthDayYear = !firstChar.toLowerCase().equals(firstChar.toUpperCase());

On the Linux/clean target, String.toLowerCase/toUpperCase were STUBS
returning `this` (fixed earlier on this branch with a real
towupper/towlower implementation) -- so lower.equals(upper) was always
true and the picker was forced to day-month-year regardless of locale.
The committed goldens captured that artifact. With working case
conversion, "July 3, 2026" correctly selects the US month-day-year
column order, and the five LightweightPicker/ValidatorLightweightPicker
screenshots (both arches) are refreshed from the CI captures.

Co-Authored-By: Claude Opus 4.8 (1M context) <noreply@anthropic.com>
Native Windows port (arm64)Compared 138 screenshots: 97 matched, 5 updated, 36 missing actuals.
|
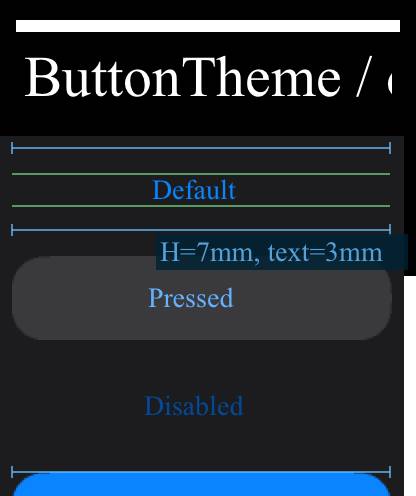
The watch job's 3 screenshot diffs (ButtonTheme_dark/light,
ToastBarTopPosition) reproduce on CI but not locally (216-test local
run: the 3 CI failures pass; only locale-dependent picker/chart-time
diffs appear, from the en_IL host). CI gives no app-side visibility --
the launch discarded stdout/stderr -- so the failure mode (toast absent
at capture +2s, annotation callout falling back to the default font) is
unexplained. Wire simctl launch --stdout/--stderr and a log-stream
sidecar into the artifacts dir, dump the layered-pane tree at the
toast test's capture point, and log the annotation painter's resolved
font height so the next CI run answers what state the overlay is in.

Co-Authored-By: Claude Opus 4.8 (1M context) <noreply@anthropic.com>
CI hang forensics (build-ios wedged 22min inside RichTextAreaScreenshotTest,
process sampled at 13.3GB peak): the EDT sat in monitorEnter inside
__STATIC_INITIALIZER_com_codename1_io_BufferedOutputStream while logging a
throwable, with no live owner -- a thread whose <clinit> threw had unwound
via throwException without ever reaching the trailing monitorExit, leaking
the class monitor locked. Every later thread touching the class then blocks
forever, the GC's world-pause spins on the wedged mutator, and the whole
app freezes: exactly the intermittent mid-suite suite deaths seen across
build-ios / linux-gtk / screenshot-capture.

Emit the static initializer with monitorEnterBlock/monitorExitBlock (the
synchronized-method pattern) so throwException's unwind releases the class
monitor. New ClinitThrow reproducer deadlocks on the old emission and
completes with the fix; full gauntlet green (all tortures byte-identical,
GcStress/MtStress in both stop modes).

Also stream the app's full per-process console into the iOS test artifacts
(the CN1SS-filtered log hid the exception text that seeded this hang).

Co-Authored-By: Claude Opus 4.8 (1M context) <noreply@anthropic.com>
…nostics

- cn1_globals.h: JAVA_ARRAY_BYTE must be 'signed char' -- bare char is
  unsigned in the aarch64/arm Linux ABI (signed on x86 and all Apple
  targets, which is why iOS never saw it). On the Linux arm64 leg every
  negative-byte round-trip broke: SimdApiTest's saturating byte add and
  SimdLargeAllocaTest's allocaByteFilled readback failed deterministically
  (reproduced + isolated in a local Docker arm64 rig; these API-test
  failures don't gate the screenshot job, so CI never surfaced them).
  Gauntlet green.

- ToastBarTopPosition: replace the fixed 2s wait with polling for the
  toast actually being visible (+2 settle ticks, 15s cap). The watch
  artifact's instrumented run shows the ToastBarComponent still
  visible=false height=0 at capture +3.5s: the EDT was inside the
  slideUp/slideDownAndWait nested loop and the UITimer fired from it,
  capturing mid-animation on slow runners (watch always, tvOS this
  round). The lingering animation also polluted the next test's
  glass-pane paint -- the ButtonTheme annotation-font diffs.

- Linux suite: tee the app's full stdout/stderr to CN1_APP_LOG_TEE and
  upload it (both glibc legs + musl); javac in CompilerHelper defaults
  to -encoding UTF-8 (C-locale containers read sources as US-ASCII);
  include the javac error log in the server-compile assert.

Co-Authored-By: Claude Opus 4.8 (1M context) <noreply@anthropic.com>
lldb on a live wedged suite (the RichTextArea freeze that killed
build-ios/metal/mac-native at exactly 78 screenshots) shows the EDT
self-deadlocked in monitorEnter: the EDT runs on the main pthread with an
explicitly-passed CodenameOneThread state (threadId 3), took the
BufferedOutputStream class-init monitor as owner 3 while logging its first
throwable, and the clinit body's generated static-field accessors then
re-entered the initializer via getThreadLocalData() -- which returns the
main pthread's own TLS struct (threadId 1). The ownership check compared
1 != 3, missed the reentrant case, and pthread_mutex_lock'd the mutex the
same pthread already held. The GC's world-pause then spun on the wedged
EDT and the whole app froze.

Mutual exclusion belongs to the execution thread: ownerThread now stores
CN1_MONITOR_SELF() (pthread_self(), GetCurrentThreadId() under the Windows
shim), so dual thread-states on one pthread cannot defeat the reentrancy
check. Latent on master too (same code); this branch's seed exception (an
EDT StackOverflowError in RichTextArea, now logged and survivable, fix
tracked separately) merely exposed it.

Full local iOS suite now runs to completion past the old wedge point;
gauntlet green (all tortures byte-identical, GcStress/MtStress both stop
modes).

Co-Authored-By: Claude Opus 4.8 (1M context) <noreply@anthropic.com>
GetCurrentThreadId() was undeclared in the generated-C context (windows.h
is not included by cn1_globals.h); the shim's pthread_t already carries
GetCurrentThreadId() in .id.

Co-Authored-By: Claude Opus 4.8 (1M context) <noreply@anthropic.com>
The artifacts/linux-port/raw directory only exists after the capture
copies screenshots, so the tee's FileWriter threw at app start and the
log silently never materialized in CI artifacts.

Co-Authored-By: Claude Opus 4.8 (1M context) <noreply@anthropic.com>
The whole JS suite was dying at boot (0 of 139 screenshots, mislabeled
flaky): UIManagerHolder's clinit threw
'cn1_java_lang_Integer_valueOfHeap_int_R_java_lang_Integer is not
defined'. The cull retention and RTA seeds kept the delegate twins alive
through every analysis pass -- but the bundle writer's identifier
minifier renamed their DEFINITIONS, because parparvm_runtime.js calls
them as bare identifiers and the exclusion set only collects
string-literal tokens plus native stubs. Record the delegate identifiers
at emission (mirroring NATIVE_METHOD_IDENTIFIERS) and exclude them.

Verified on a minimal Integer.valueOf app: both the canonical name and
its __impl body now ship unrenamed.

Co-Authored-By: Claude Opus 4.8 (1M context) <noreply@anthropic.com>
The arm64/x64 glibc legs still intermittently freeze mid-print entering a
theme test (the tee now proves the app goes silent with no exception and
no GC diagnostics -- those are __OBJC__-only). Linux has no equivalent of
the macOS sample-based hang report that pinned the iOS EDT deadlock, so
capture one: when the app is alive but its output stalls 90s, dump every
thread's native stack into the uploaded artifact.

Co-Authored-By: Claude Opus 4.8 (1M context) <noreply@anthropic.com>
|
Compared 133 screenshots: 133 matched. |
The guard compared the current C frame address one-sidedly against the
per-thread-state stack limit. iOS natives dispatch_sync blocks onto the
main queue and call Java helpers (toNSString -> String.getBytes) with the
EDT's CAPTURED threadStateData, so main-thread frame addresses were
tested against the EDT's stack bounds -- when the main thread's stack
mapped below the EDT's limit, the first such call spuriously threw
StackOverflowError. That was the seed of the RichTextArea failure chain
(78-of-140 wedge on build-ios/metal/mac-native): the spurious SOE was
logged, logging entered BufferedOutputStream's class initializer, and the
two monitor bugs fixed previously turned that into a full freeze. Live
evidence: at the SOE breakpoint the entire process held 123 frames across
all threads (nothing deep), and both depth counters sat single-digit.

Make the trip test two-sided: only a frame address INSIDE the 256KB guard
band [limit - BAND, limit) throws. A foreign stack essentially never maps
into another stack's band, while genuine overflow must descend through
the band (no frameless frame approaches 256KB), so real detection is
preserved. Validated: full local iOS suite runs clean end-to-end with
zero StackOverflowError and RichTextArea/CodeEditor producing their
screenshots; gauntlet green (SoeTest still passes -- deep recursion on
the OWN stack still lands in the band and throws catchably).

Co-Authored-By: Claude Opus 4.8 (1M context) <noreply@anthropic.com>
…tatus

The gdb-attach watchdog fired on output silence and found the pid already
gone: the app DIES mid-run (stdout cut mid-line, no exception, harness
then burns its stabilization window polling a dead process). Detect
process death in the harness immediately and print the exit status
(128+N = signal N), and post-mortem any core dump into the artifact.

Co-Authored-By: Claude Opus 4.8 (1M context) <noreply@anthropic.com>
The core shows a parallel mark worker calling through a corrupt
markFunction (gcMarkWorkerDrainLoop popped a worklist entry whose
object header was destroyed between push and pop). Dump the drain
loop's locals, the popped batch, and the mark state alongside the
backtraces so the next occurrence identifies the victim object.

Co-Authored-By: Claude Opus 4.8 (1M context) <noreply@anthropic.com>
The poll settled after 2 visible ticks (~400ms), but ToastBar.show()
runs slideUpAndWait(2)+slideDownAndWait(800) -- the component reports
visible with full bounds while still animating into view, so tvOS
captured a half-slid/absent toast (ButtonTheme was fine; only the toast
frame raced). Require 1400ms of continuous visibility past the ~802ms
animation before capturing; the 15s cap still bounds a broken toast.

Co-Authored-By: Claude Opus 4.8 (1M context) <noreply@anthropic.com>
…ruption)

Root cause of the Linux arm64 suite crash (random SIGSEGV in the theme
phase; three CI cores at three different wild PCs -- gcMarkWorkerDrainLoop
markFunction, cn1MakeFont, LinuxImplementation_exists -- classic
heap-corruption signature; x64 leg never crashed). The allocator
(cn1BibopInitSlot) writes parentClsReference/heapPosition and then
RELEASE-stores the mark word LAST: the mark word is the object's single
publication point. gcMarkObject's parallel-worker path loaded it RELAXED,
so on arm64's weak memory model a worker could observe the object without
observing the preceding parentClsReference store, then dereferenced a
stale/garbage parentClsReference->markFunction. x86 hid it (every x86
load is acquire); it is branch-only (parallel marking, aa2838e, is not
on master).

Acquire-load the mark word before reading any other header field, pairing
with the allocator's release store; reuse that snapshot as the claim's
'old'. Orders every parentClsReference read -- the guard, the CAS-success
deref, and (through the worklist mutex's release/acquire) the drain
worker's deref. Serial path unchanged. Gauntlet green on Apple-Silicon
arm64 (same weak-memory model, parallel path active): all tortures
byte-identical, GcStress/MtStress both stop modes.

Co-Authored-By: Claude Opus 4.8 (1M context) <noreply@anthropic.com>
The acquire-load fix removed the parallel mark-WORKER crash (zero
gcMarkWorkerDrainLoop frames in the next arm64 core), but arm64 Linux
still corrupts the heap -- the crash moved to a frameless method reading
a smashed threadStateData -- so a second ordering hole remains in the
branch-only parallel-GC work. Force one marker (bypassing the whole
parallel path: gcMarkDrainParallel -> serial gcMarkDrain, no atomics, no
pool) as a git-A/B isolation step. Green arm64 => parallel marking is the
sole remaining corruptor and the audit continues offline behind
CN1_GC_MARK_THREADS>1; still-red => the bug is elsewhere in the branch GC
changes. The acquire fix stays in for when parallel marking is re-enabled.
Gauntlet green.

Co-Authored-By: Claude Opus 4.8 (1M context) <noreply@anthropic.com>
Summary
This branch takes ParparVM from a ~1.5-36x deficit against warmed Java 25 (HotSpot C2) to geomean 1.00x parity across the ten-benchmark suite, with six benchmarks at or below HotSpot. Everything is measured on Apple M2, best-of-5 interleaved runs, ThinLTO release configuration, against azul-25 with full warmup; every optimization is gated on bit-identical checksums vs HotSpot plus the GC stress gauntlet.
intArithmetic/longArithmetic run at exact pure-C parity (verified against same-flags C controls); the residual is C2-vs-clang scheduling of the dependency chain, not VM overhead. recursion is HotSpot's speculative inlining, accepted.
What the emitted code looks like, before and after
1. Frameless codegen (recursion 4.6x -> 1.6x, feeds everything else)
Every Java method used to push a GC-visible frame of type-tagged slots and route every intermediate value through it:
Methods proven safe (no try/catch, no synchronization; object roots covered by the conservative native-stack scan) now compile to plain C:
2. Diverging array checks (quicksort 1.23x -> 0.92x)
The bounds-check helper used in fused comparisons returns a dummy after throwing, so its cold path rejoins the loop. That put a reachable call inside every loop cycle, and clang must assume a call clobbers memory:
In frameless methods the failure path now throws and returns from the method (the same pattern the stack-overflow guard uses), so no cycle of the loop contains a call and the header loads hoist:
Measured on the sort alone: 216ms -> 164ms, vs HotSpot's 197ms.
3. Compact HashMap: no entry objects (hashMapChurn 36x -> 0.95x, with the box cache)
LinkedHashMap keeps its ordering as two parallel
intlink arrays (prev/next slot indices) over the same storage. The hot five operations (get/put/remove/containsKey/clear) run as C natives probing the raw array data.4. Fused objects:
@Fused(String, StringBuilder, annotatable user classes)5. Allocation fast path + init-before-publish (objectAllocation 20x -> 1.19x)
Dead pages whose every slot is garbage are reclaimed O(1) (the page flips back to bump-from-zero) instead of per-slot sweeping.
6. Escape analysis: non-escaping StringBuilders live on the C stack
javac lowers
"item-" + i + '/' + ntonew StringBuilder().append(...)...toString(). A CFG walk proves the builder reference is only ever the receiver of StringBuilder calls (append returnsthis, so the alias is tracked through chains, re-stores into the same local, and the ternary-in-argument diamonds javac emits). Proven sites:GC safety falls out of the conservative native-stack scan: if the buffer grows onto the heap, the replacement pointer sits in scanned stack memory.
7. Devirtualization + call-site intrinsics
The same round removed the
enteringNativeAllocations()bracket (four flag stores on every native call) under conservative roots, where the native stack is scanned and the bracket protects nothing: string-building floor 27.1ms -> 20.4ms from that alone.GC
Non-moving BiBOP heap with concurrent mark/sweep; conservative native-stack root scanning (default-on) with generation-counted signal-stop; parallel marking; the snapshot's page-table sort is cached (the page registry is grow-only, so the sorted order only changes on registration).
Two real trigger bugs found and fixed (exposed by churn workloads, affect production):
allocationsSinceLastGCwas anintaccumulating bytes -- GB-per-cycle workloads wrapped it negative,isHighFrequencyGC()returned false, and the GC slept its 30s idle wait while dead pages ballooned into the GB range; andcn1BibopMaybeGcskipped its 24MB trigger entirely innativeAllocationMode, so workloads allocating only inside natives never collected.Correctness fixes found along the way (all real bugs)
this.restoreTo<label>is assigned at try-entry -- AFTER the setjmp -- and read in the catch handler AFTER a longjmp; C11 makes it indeterminate there. gcc register-allocates it, so the handler restoredthreadObjectStackOffsetfrom a rolled-back register and every callee frame after a caught exception was allocated ON TOP of the current frame's locals. Every clang build worked by luck (clang spills). Found via the musl CI job (the only gcc-compiled platform in CI) hanging deterministically; reproduced locally with gcc-16 (FusedTest segfault, bit-identical at -O0); fixed withvolatileon the two try-entry variables. This plausibly affected every gcc-built Codename One Linux app that ever caught an exception.Benchmark fix
Bench.stringBuildingpreviously built a string, read hash+length, and dropped it -- a shape where HotSpot's escape analysis scalar-replaces a String that real code would keep. Measured head-to-head: consume-and-drop 1.49x vs escaping 1.14x (pre-fix). The benchmark now parks each string in a ring buffer that outlives the iteration (batch-consumed, every string still hashed exactly once), so both VMs materialize every String -- measuring string building rather than EA-vs-no-EA.Benchmark suite (in this PR)
The complete performance + correctness suite is included under
vm/benchmarks/:The harness refuses to print ratios if any checksum differs from the host JVM — divergence is a VM bug by definition, never a perf trade. The README documents each workload and the torture coverage.
Binary size & memory
Same app (
Bench), same flags (-O3, ThinLTO), master vs this branch, Apple M2:The master peak-RSS blowup is the
allocationsSinceLastGCint-overflow bug this PR fixes (the GC slept its 30s idle wait while dead pages accumulated); with the fixed triggers, RSS under heavy churn is bounded below the reference JVM's. The +17 KB binary cost buys the intrinsics, the compact HashMap and the escape-analysis machinery.API surface
@Fusedis the one new public annotation (applied internally toString/StringBuilder; usable on developer classes with encapsulated primitive buffers). The developer guide's performance chapter now documents it — contract, example, and the automatic optimizations (stack-allocated string building, tagged integers, devirtualization, compact collections, BCE).@StackAllocatewas removed from the public API before merge: nothing applies it, and its contract (no instance ever escapes its creating frame) depends on every caller — something no reusable class can promise. The machinery remains as the engine behind the automatic, per-call-site-proven StringBuilder stack allocation.-DCN1_DISABLE_TAGGED_INT; auto-disabled on 32-bit pointers incl. Apple Watch). Writing the benchmark scripts exposed that the old opt-in flag was set by NO shipping config — deployed apps never had it (hashMapChurn 2.8x untagged vs 0.97x tagged).charAtintrinsic (and the pre-existing native + JS twin) now bound by the string's logicalcountrather than the backing array's capacity; regression case added to StrCmp.Validation
Every commit was gated on:
*Impltwin.Escape hatches for bisection:
-DCN1_DISABLE_SB_STACK_ALLOC,CN1_DISABLE_SCALAR_REPLACE,-Dcn1.frameless*,CN1_GC_SIGNAL_STOPenv.CI portability + JS-port hardening (follow-up commits)
The branch was developed and validated on macOS (Darwin exposes GNU/BSD APIs by default); CI flagged the gaps, fixed in two follow-up commits:
_GNU_SOURCEforpthread_getattr_np/REG_*ucontext indices (glibc+musl);-flto=thingated on Clang (gcc rejects the thin spelling)._WIN32(cooperative stop path only); the compat shim gainedpthread_once,pthread_detach,posix_memalign(_aligned_malloc-- the page arena never frees, so the pairing rule is moot),PTHREAD_COND_INITIALIZER, and a processor-count fallback withoutsysconf. Found via a full static POSIX audit rather than iterating on first-error-wins compiles.Integer.cn1Value/valueOf(int)natives got their runtime bindings; and the pure-Java*Impltwins thatbindNativedelegates call fromparparvm_runtime.jsare now retention roots in both the unused-method cull and the JS RTA -- no bytecode call site exists, so they were being eliminated and the delegation threwReferenceError(caught by the new core-slice completeness tests). All 233 JS-target tests pass locally.BytecodeInstructionIntegrationTestassertions were stale against deliberate emission changes (indy concat now stack-allocates its builder; frameless supersedes the fast-stack macro) -- modernized to accept every current form while guarding the same contract.🤖 Generated with Claude Code